CASCADE
Note:
This case study has been sanitised to comply with non-disclosure agreement (NDA) restrictions. Logos, brand names, and select visuals have been replaced or modified. The strategic approach, design thinking, and product decisions showcased here are fully representative of the work done, while respecting confidentiality agreements.
Context
Context
Fractal Analytics is a global AI and advanced analytics company that partners with Fortune 500 clients to drive data-backed decision-making. One of its key clients, Venus Vetcare (name changed for NDA compliance), is the animal health division of a global CPG giant, focused on improving veterinary care through better insights and operational tools.
Fractal Analytics is a global AI and advanced analytics company that partners with Fortune 500 clients to drive data-backed decision-making. One of its key clients, Venus Vetcare (name changed for NDA compliance), is the animal health division of a global CPG giant, focused on improving veterinary care through better insights and operational tools.
Fractal Analytics is a global AI and advanced analytics company that partners with Fortune 500 clients to drive data-backed decision-making. One of its key clients, Venus Vetcare (name changed for NDA compliance), is the animal health division of a global CPG giant, focused on improving veterinary care through better insights and operational tools.
As part of the design team at Fractal, we worked closely with Venus Vetcare’s marketing analytics group to create Cascade - a unified platform that brings together e-commerce, in-store, and promotional data into a single source of truth.
As part of the design team at Fractal, we worked closely with Venus Vetcare’s marketing analytics group to create Cascade - a unified platform that brings together e-commerce, in-store, and promotional data into a single source of truth.
As part of the design team at Fractal, we worked closely with Venus Vetcare’s marketing analytics group to create Cascade - a unified platform that brings together e-commerce, in-store, and promotional data into a single source of truth.
The Problem
The Problem
The e-commerce, marketing, and brand teams at Venus Vetcare operated in silos - each with their own dashboards, trackers, and ways of reporting. Turning data into decisions was a time-consuming process, often slowed down by inconsistent metrics, misaligned reports, and scattered insights.
The e-commerce, marketing, and brand teams at Venus Vetcare operated in silos - each with their own dashboards, trackers, and ways of reporting. Turning data into decisions was a time-consuming process, often slowed down by inconsistent metrics, misaligned reports, and scattered insights.
The e-commerce, marketing, and brand teams at Venus Vetcare operated in silos - each with their own dashboards, trackers, and ways of reporting. Turning data into decisions was a time-consuming process, often slowed down by inconsistent metrics, misaligned reports, and scattered insights.
Making sense of performance meant jumping between multiple Excel sheets, PDFs, and outdated decks, with no single source of truth, and no easy way to move from numbers to action. But behind every disconnected system are real people doing their best to make it work. Let’s take a look at how that played out.
Making sense of performance meant jumping between multiple Excel sheets, PDFs, and outdated decks, with no single source of truth, and no easy way to move from numbers to action. But behind every disconnected system are real people doing their best to make it work. Let’s take a look at how that played out.
Making sense of performance meant jumping between multiple Excel sheets, PDFs, and outdated decks, with no single source of truth, and no easy way to move from numbers to action. But behind every disconnected system are real people doing their best to make it work. Let’s take a look at how that played out.
🧑💼 Meet Jim, a Brand Manager at Venus Vetcare
🧑💼 Meet Jim, a Brand Manager at Venus Vetcare
He starts his Monday like any other:
He starts his Monday like any other:

Jim is trying to understand why Product [X] from Brand [Y] is down in Region [Z].
But every answer depends on a different Excel Sheet, built by a different team, with a different format.
All siloed. All delayed. He’s not managing a brand - he’s trying to stitch a storyline, but in vain.
Jim is trying to understand why Product [X] from Brand [Y] is down in Region [Z]. But every answer depends on a different Excel Sheet, built by a different team, with a different format. All siloed. All delayed.
He’s not managing a brand - he’s trying to stitch a storyline, but in vain.
Jim is trying to understand why Product [X] from Brand [Y] is down in Region [Z]. But every answer depends on a different Excel Sheet, built by a different team, with a different format. All siloed. All delayed. He’s not managing a brand - he’s trying to stitch a storyline, but in vain.
📉 Elsewhere: Pam Can’t Find the Right Ecommerce Insight
📉 Elsewhere: Pam Can’t Find the Right Ecommerce Insight

Pam, the Ecom Insight Manager, wants to optimise their brand's availability and visibility on Amazon.
She’s bouncing between keyword tools, in-stock reports, and internal shared trackers.
Data is lagging, insights are late, and decisions feel like educated guesses.
Pam, the Ecom Insight Manager, wants to optimise their brand availability and visibility on Amazon. She’s bouncing between keyword tools, in-stock reports, and internal shared trackers. Data is lagging, insights are late, and decisions feel like educated guesses.
Pam, the Ecom Insight Manager, wants to optimise their brand's availability and visibility on Amazon. She’s bouncing between keyword tools, in-stock reports, and internal shared trackers. Data is lagging, insights are late, and decisions feel like educated guesses.
📊 And Michael? His Media Sheet Isn’t Telling the Full Story
📊 And Michael? His Media Sheet Isn’t Telling the Full Story

Michael, the Media Manager, wants to make sure they're spending on the right media campaigns.
Michael’s team spent $12M on campaigns last quarter. But was the spend driving impact
or just noise? He’s staring at multiple Excel files with 18 filters and no answers.
Michael, the Media Manager, wants to make sure they're spending on the right media campaigns. Michael’s team spent $12M on campaigns last quarter. But was the spend driving impact or just noise? He’s staring at multiple Excel files with 18 filters and no answers.
Michael, the Media Manager, wants to make sure they're spending on the right media campaigns. Michael’s team spent $12M on campaigns last quarter. But was the spend driving impact or just noise? He’s staring at multiple Excel files with 18 filters and no answers.
Pain Points with the Current Workflow
Pain Points with the
Current Workflow
Fragmented Access to Performance Data
Teams were dependent on multiple tools, formats, and stakeholders just to get basic performance signals — making quick decision-making nearly impossible.
Fragmented Access to Performance Data
Teams were dependent on multiple tools, formats, and stakeholders just to get basic performance signals — making quick decision-making nearly impossible.
Fragmented Access to Performance Data
Teams were dependent on multiple tools, formats, and stakeholders just to get basic performance signals — making quick decision-making nearly impossible.
Siloed Reporting & Delays
Stakeholders had to wait for manually compiled reports from different departments, causing delays in spotting business-critical issues.
Siloed Reporting & Delays
Stakeholders had to wait for manually compiled reports from different departments, causing delays in spotting business-critical issues.
Siloed Reporting & Delays
Stakeholders had to wait for manually compiled reports from different departments, causing delays in spotting business-critical issues.
Lack of Root Cause Visibility
Whether it was a dip in innovation velocity or SOV performance, users struggled to identify the underlying drivers and drainers in a cohesive view.
Lack of Root Cause Visibility
Whether it was a dip in innovation velocity or SOV performance, users struggled to identify the underlying drivers and drainers in a cohesive view.
Lack of Root Cause Visibility
Whether it was a dip in innovation velocity or SOV performance, users struggled to identify the underlying drivers and drainers in a cohesive view.
Manual Forecasting & Excel Overload
Forecasting relied on unscalable Excel sheets owned by a few, lacking standardization, repeatability, or confidence in accuracy.
Manual Forecasting & Excel Overload
Forecasting relied on unscalable Excel sheets owned by a few, lacking standardization, repeatability, or confidence in accuracy.
Manual Forecasting & Excel Overload
Forecasting relied on unscalable Excel sheets owned by a few, lacking standardization, repeatability, or confidence in accuracy.
The Solution: Cascade
The Solution: Cascade
Cascade is a multi-phase enterprise intelligence tool designed to help brand, e-commerce, innovation, media, leadership and finance teams at Venus Vetcare monitor performance KPIs, detect anomalies, and take strategic action across the value chain. The platform evolved into a single source of truth across 5 use cases, scaling to serve global stakeholders.
Our goal was to turn a jungle of reports into a single, modular, human-friendly platform - where Jim, Pam, and Michael could not just see data, but actually act on it by taking strategic decisions.
The Impact
Cut time to insight for eCom teams from 8 hours to 1 hour
Automated data pulls, real-time alerts, and insight cards eliminated manual prep, helping teams act faster on what mattered.
Cut time to insight for eCom teams from 8 hours to 1 hour
Automated data pulls, real-time alerts, and insight cards eliminated manual prep, helping teams act faster on what mattered.
Cut time to insight for eCom teams from 8 hours to 1 hour
Automated data pulls, real-time alerts, and insight cards eliminated manual prep, helping teams act faster on what mattered.
Reduced report compile time by 75%
Users could create custom reports by selecting KPIs directly from the dashboard - no more taking screenshots, editing, and compiling them into decks like before.
Reduced report compile time by 75%
Users could create custom reports by selecting KPIs directly from the dashboard - no more taking screenshots, editing, and compiling them into decks like before.
Reduced report compile time by 75%
Users could create custom reports by selecting KPIs directly from the dashboard - no more taking screenshots, editing, and compiling them into decks like before.
Brought 124 global users into one platform in Phase 1
United fragmented teams across brands, geographies, and functions into a single unified workspace for analytics.
Brought 124 global users into one platform in Phase 1
United fragmented teams across brands, geographies, and functions into a single unified workspace for analytics.
Brought 124 global users into one platform in Phase 1
United fragmented teams across brands, geographies, and functions into a single unified workspace for analytics.
Client Feedback
🎖️ NPS: 10/10 🎖️
🎖️ NPS: 10/10 🎖️
🎖️ NPS: 10/10 🎖️
I love how the team brought best-in-class data visualization recommendations. They partnered closely with the business to deeply understand our data needs and pushed our reporting beyond the original scope. The transparency and collaboration throughout made it a truly effective partnership. The design team, in particular, stood out for their empathy - translating user challenges into a solution that felt intuitive and genuinely impactful.

Amanda G
Sr Market Insights Manager, NA Region
I love how the team brought best-in-class data visualization recommendations. They partnered closely with the business to deeply understand our data needs and pushed our reporting beyond the original scope. The transparency and collaboration throughout made it a truly effective partnership. The design team, in particular, stood out for their empathy - translating user challenges into a solution that felt intuitive and genuinely impactful.
Amanda G
Sr Market Insights Manager, NA Region
But how did we achieve this?
The Process
The Process
We created a tailormade process which worked for all the five usecases.
We created a tailormade process which worked for all the five usecases.

Research & Synthesis
Research & Synthesis
📊 Reviewed business reports shared by the client to understand existing workflows and data dependencies.
❓ Mapped questions across design, data, and business domains using a custom Discovery Session Template (Excel).
🎙️ Conducted stakeholder sessions across teams to gather wishlist features, current pain points, and unmet needs in the current workflow.
📂 Organized findings on a shared FigJam board to spot overlaps, disconnects, and opportunity spaces.
🧠 Synthesized insights into a structured deck, summarizing user expectations, goals, and friction points.
✅ Secured sign-off on the synthesis before moving into design explorations.
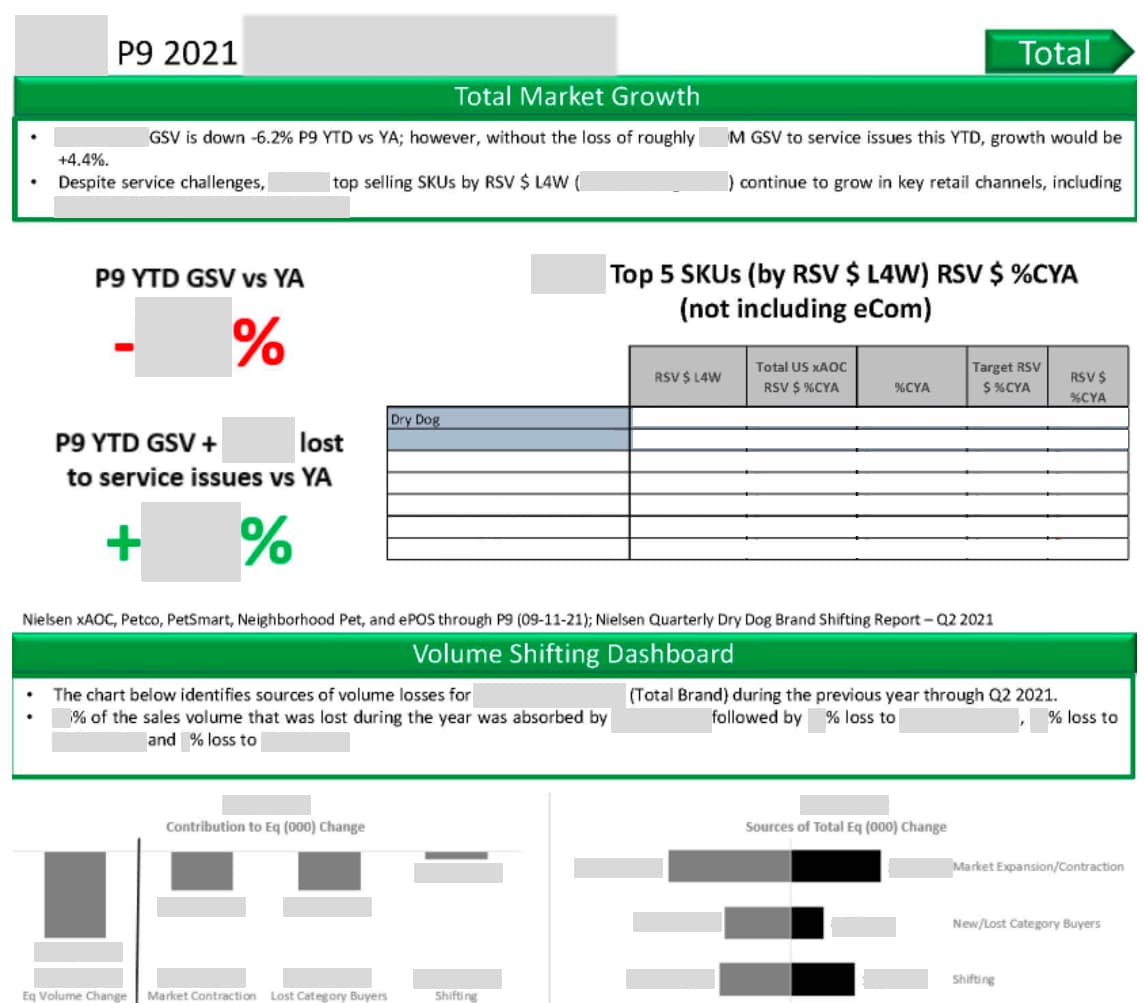


Current business insight reports created manually by the team, after juggling between multiple spreadsheets and platforms.
Current business insight reports created manually by the team, after juggling between multiple spreadsheets and platforms.
The Use Cases
The Use Cases
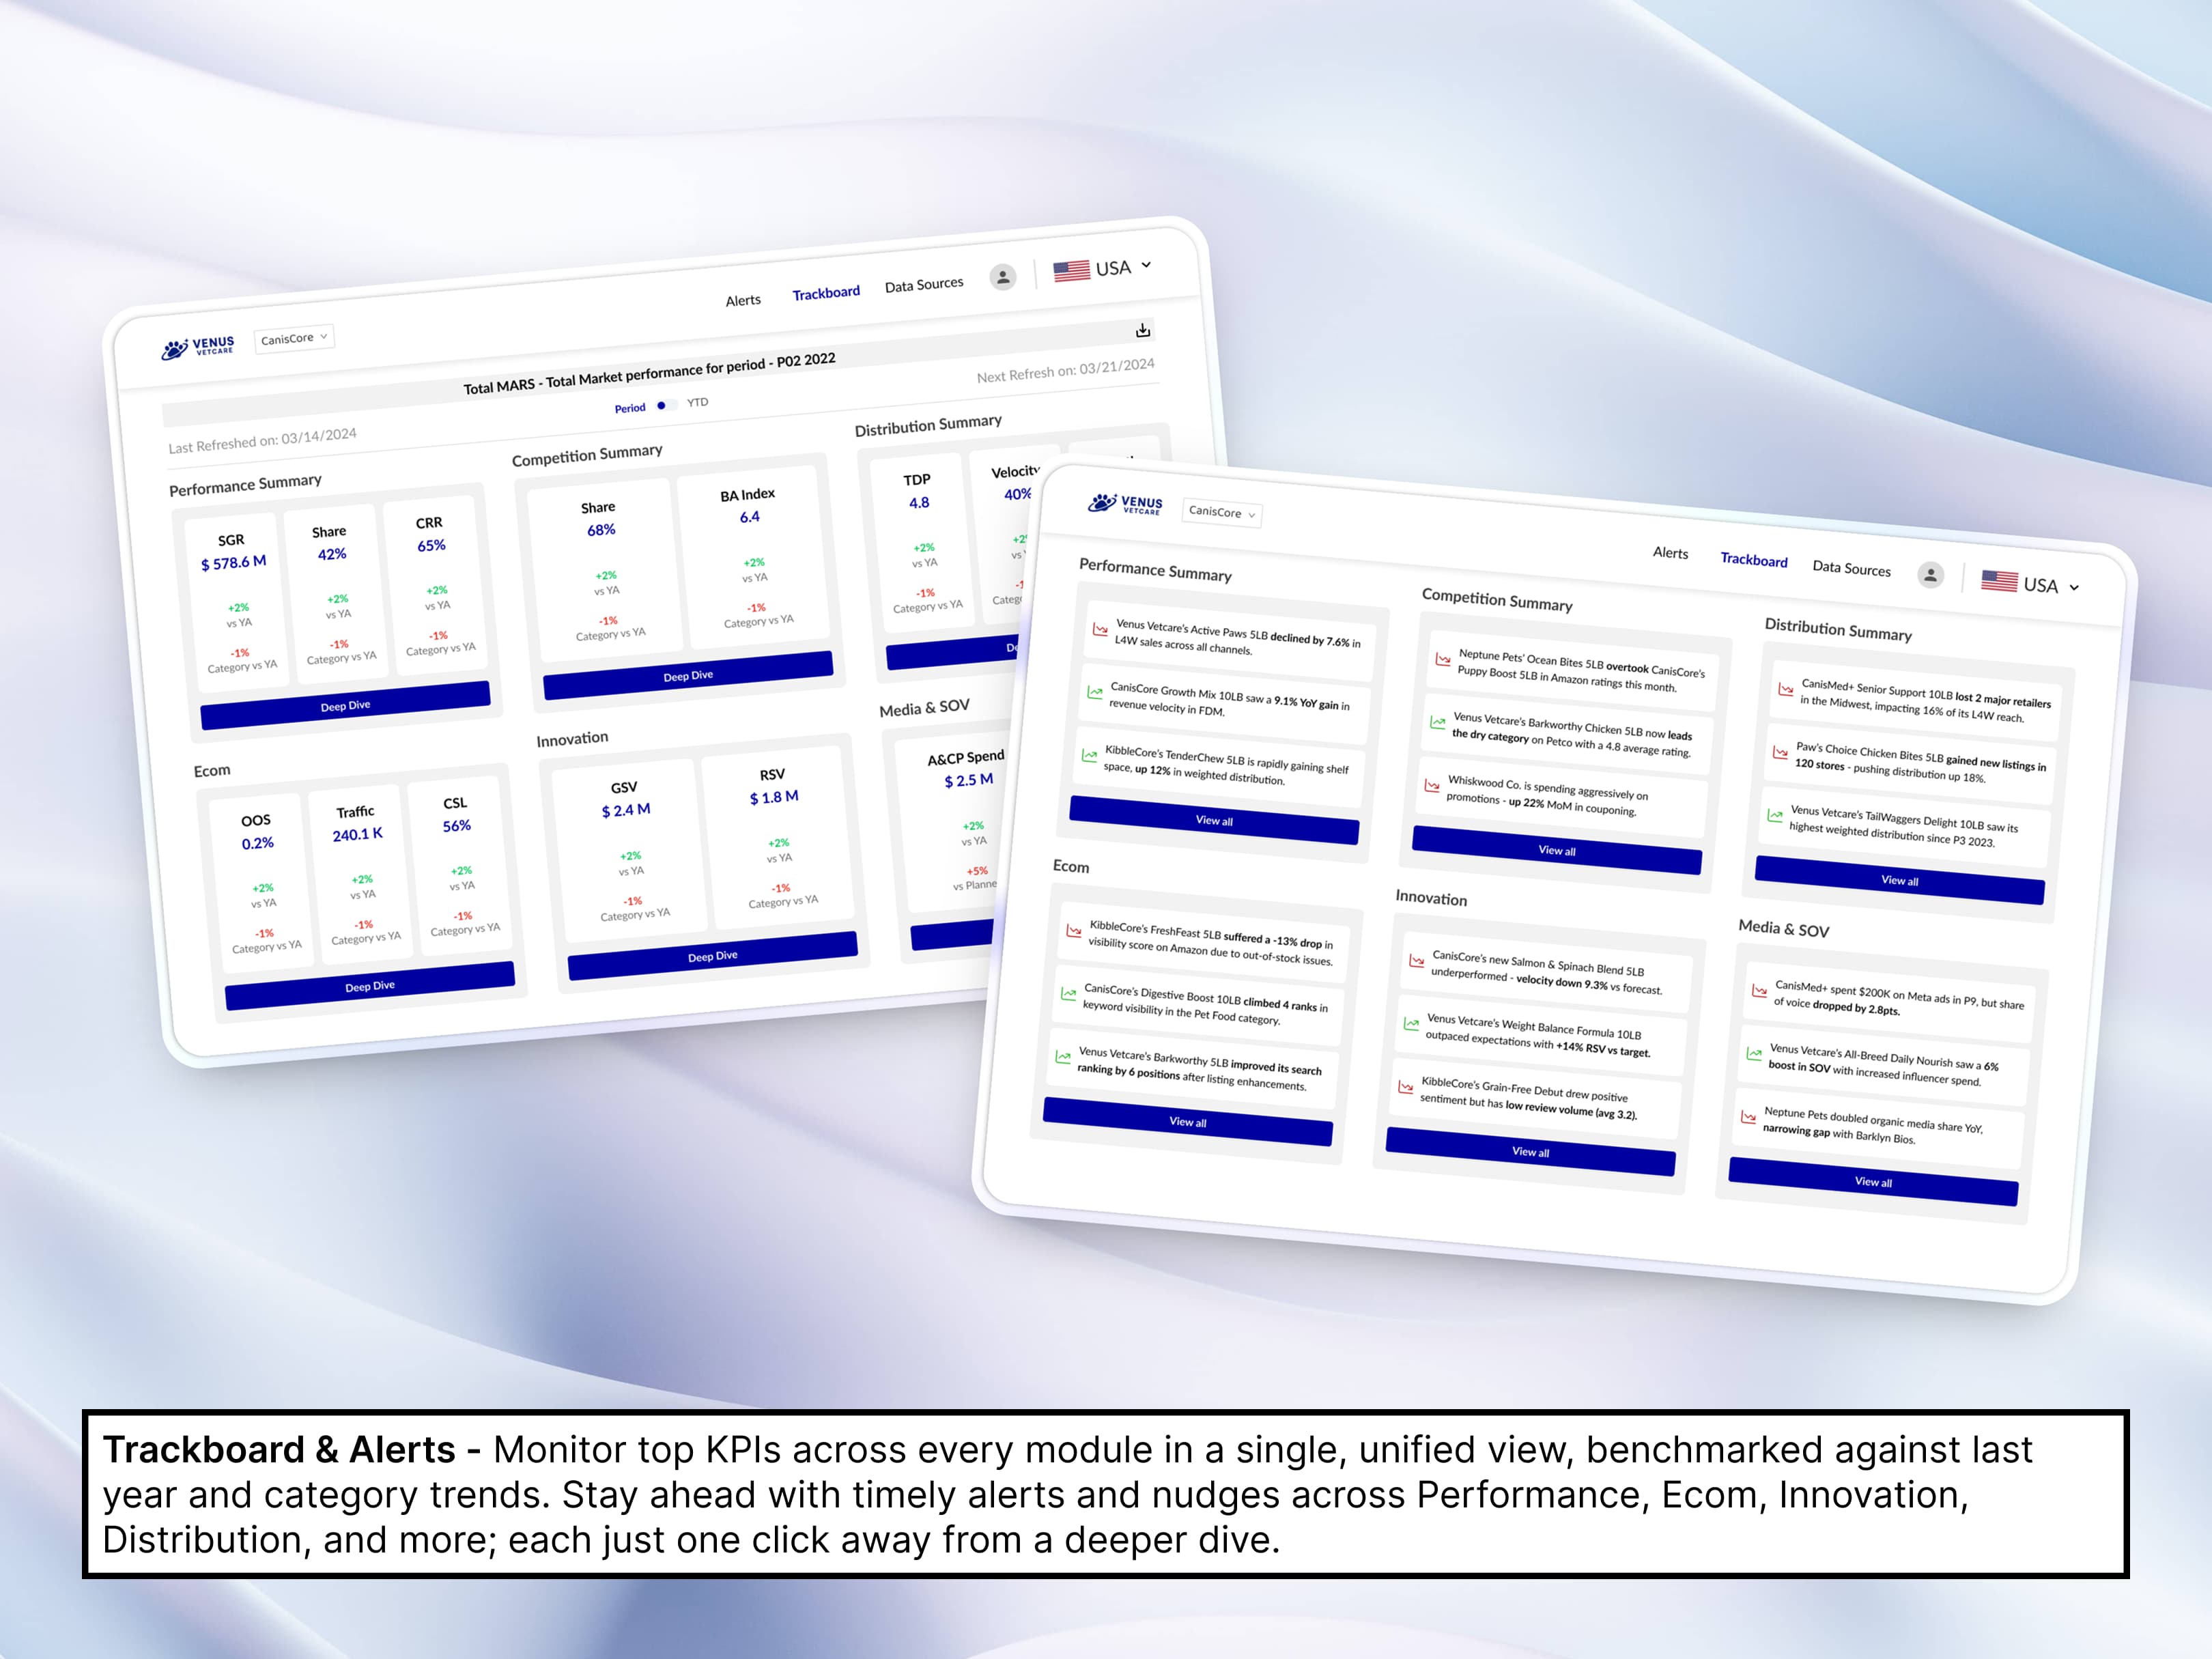
Performance, Competition, Distribution
🔹 KPI comparison vs. competition, nudges for deviation 🔸 Trend views, retailer splits, manufacturer vs. brand slices
Performance, Competition, Distribution
🔹 KPI comparison vs. competition, nudges for deviation 🔸 Trend views, retailer splits, manufacturer vs. brand slices
Performance, Competition, Distribution
🔹 KPI comparison vs. competition, nudges for deviation 🔸 Trend views, retailer splits, manufacturer vs. brand slices
Innovation
🔹 Launch performance: GSV, velocity, distribution, media spends 🔸 Actual vs. forecast, driver-drainer analysis 🔹 Reviews and volume contribution comparisons
Innovation
🔹 Launch performance: GSV, velocity, distribution, media spends 🔸 Actual vs. forecast, driver-drainer analysis 🔹 Reviews and volume contribution comparisons
Innovation
🔹 Launch performance: GSV, velocity, distribution, media spends 🔸 Actual vs. forecast, driver-drainer analysis 🔹 Reviews and volume contribution comparisons
Ecom
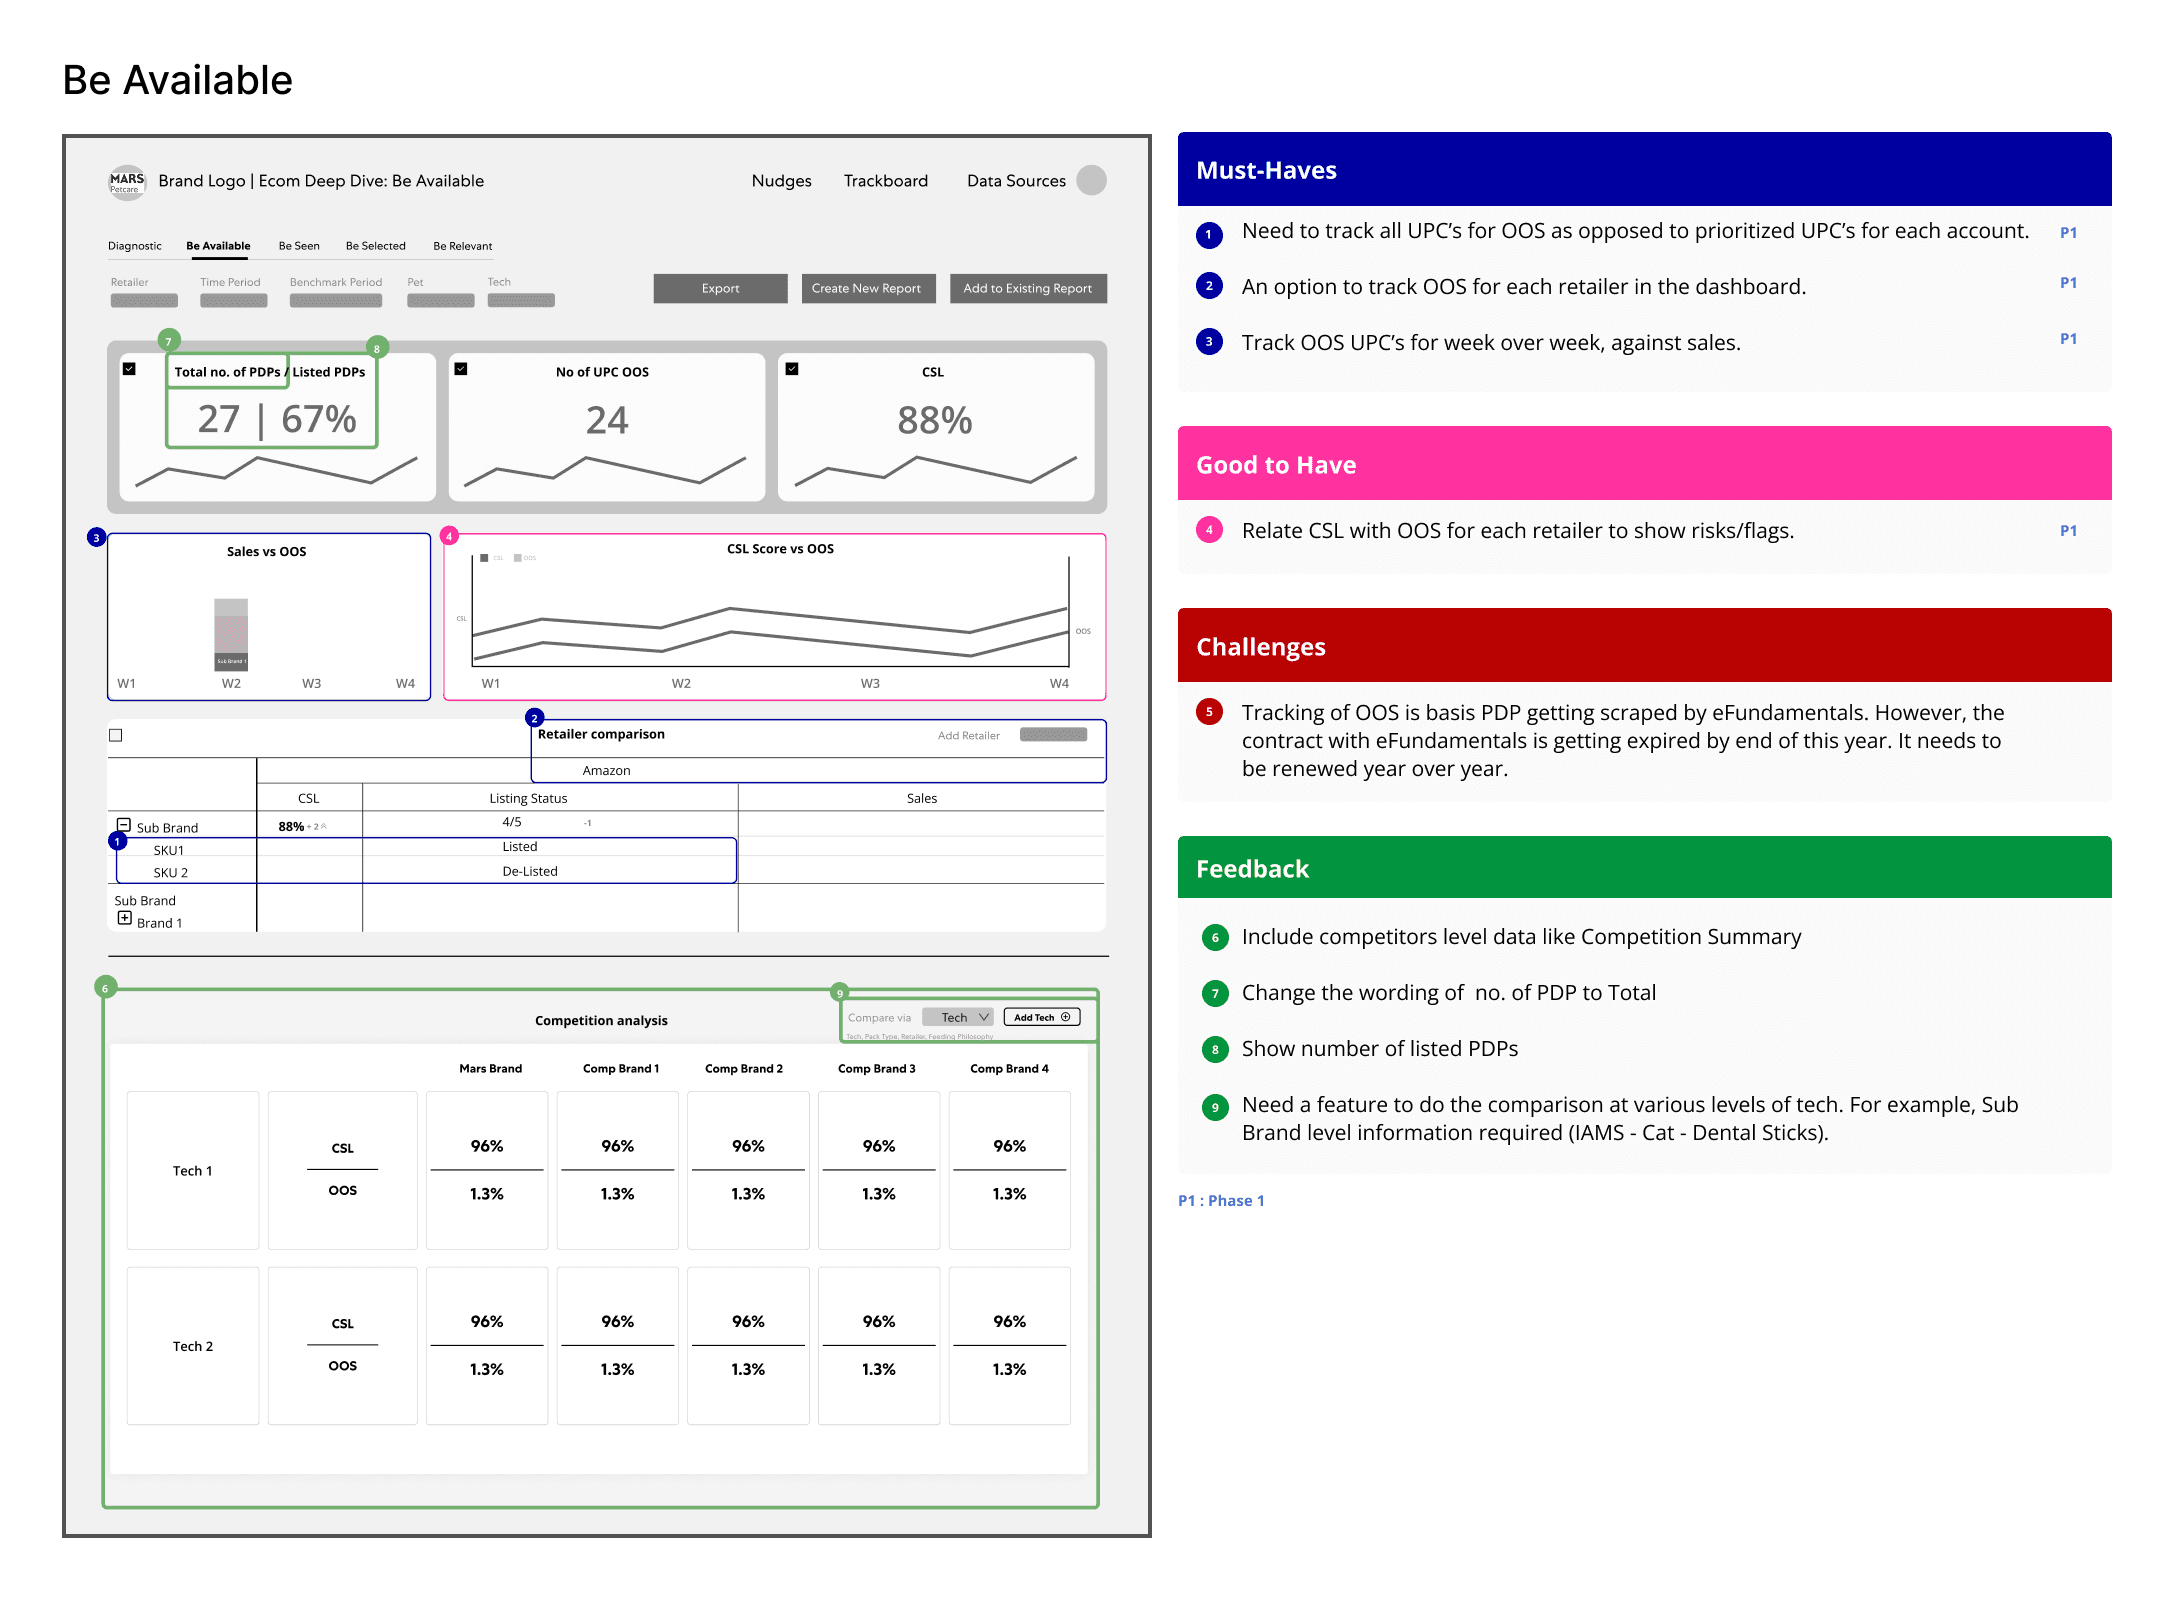
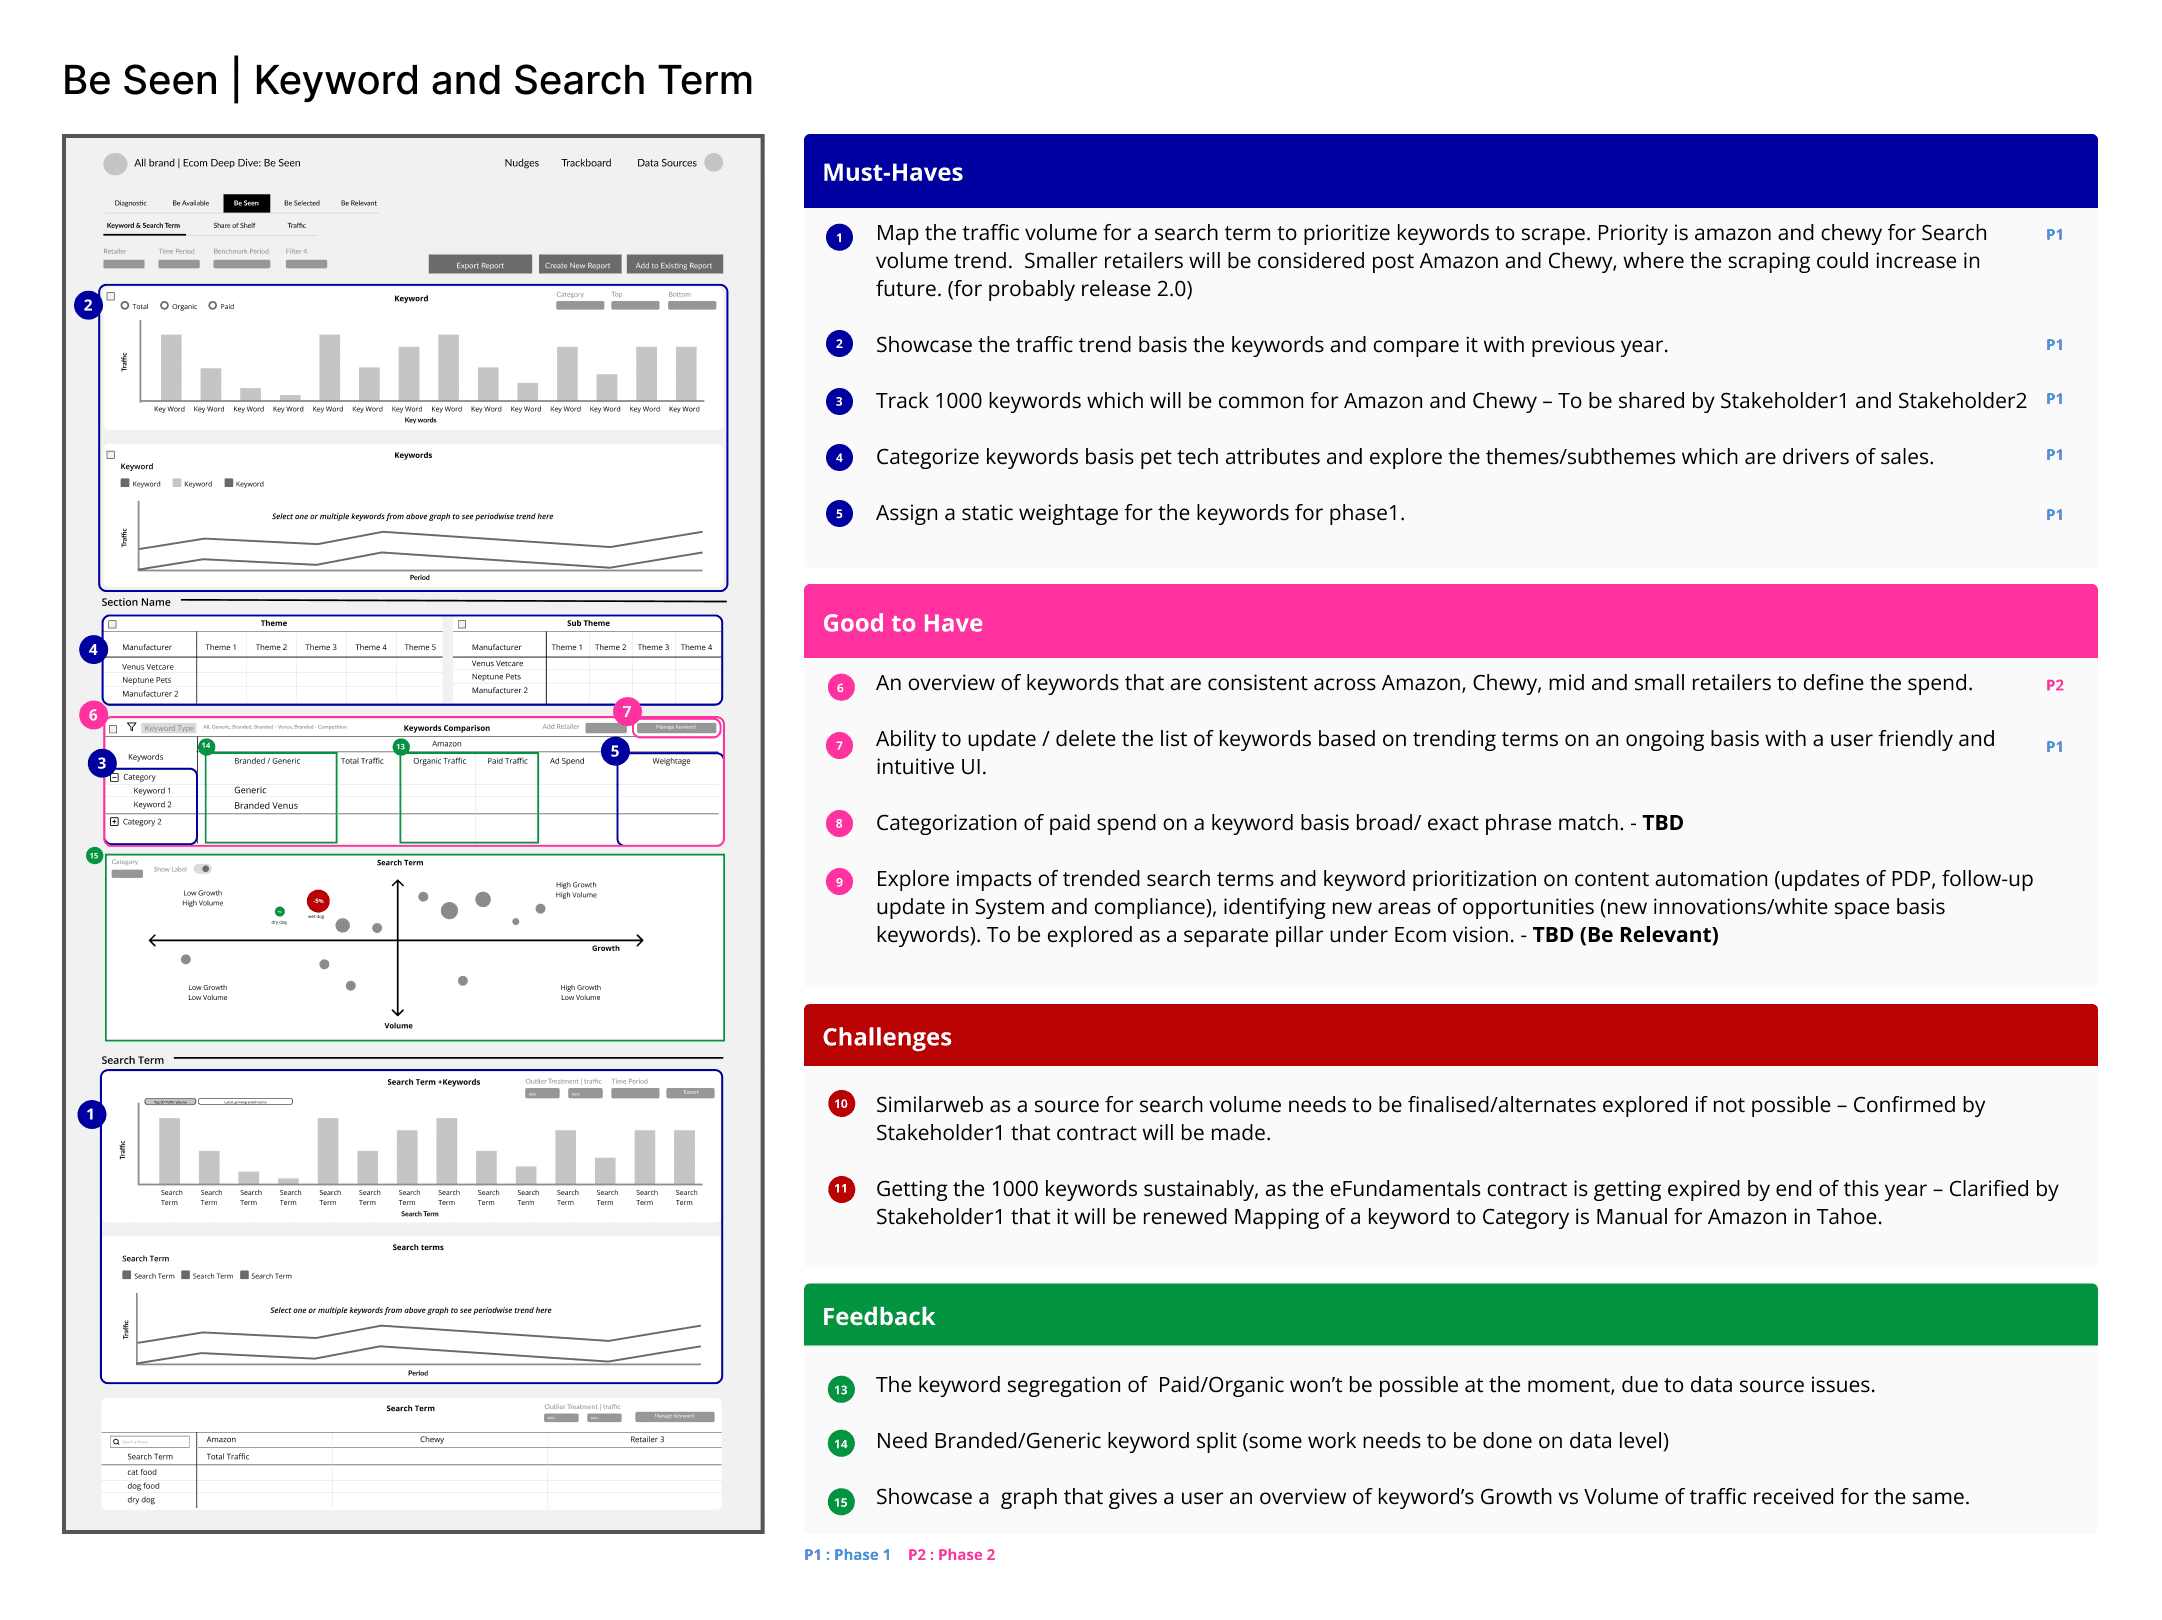
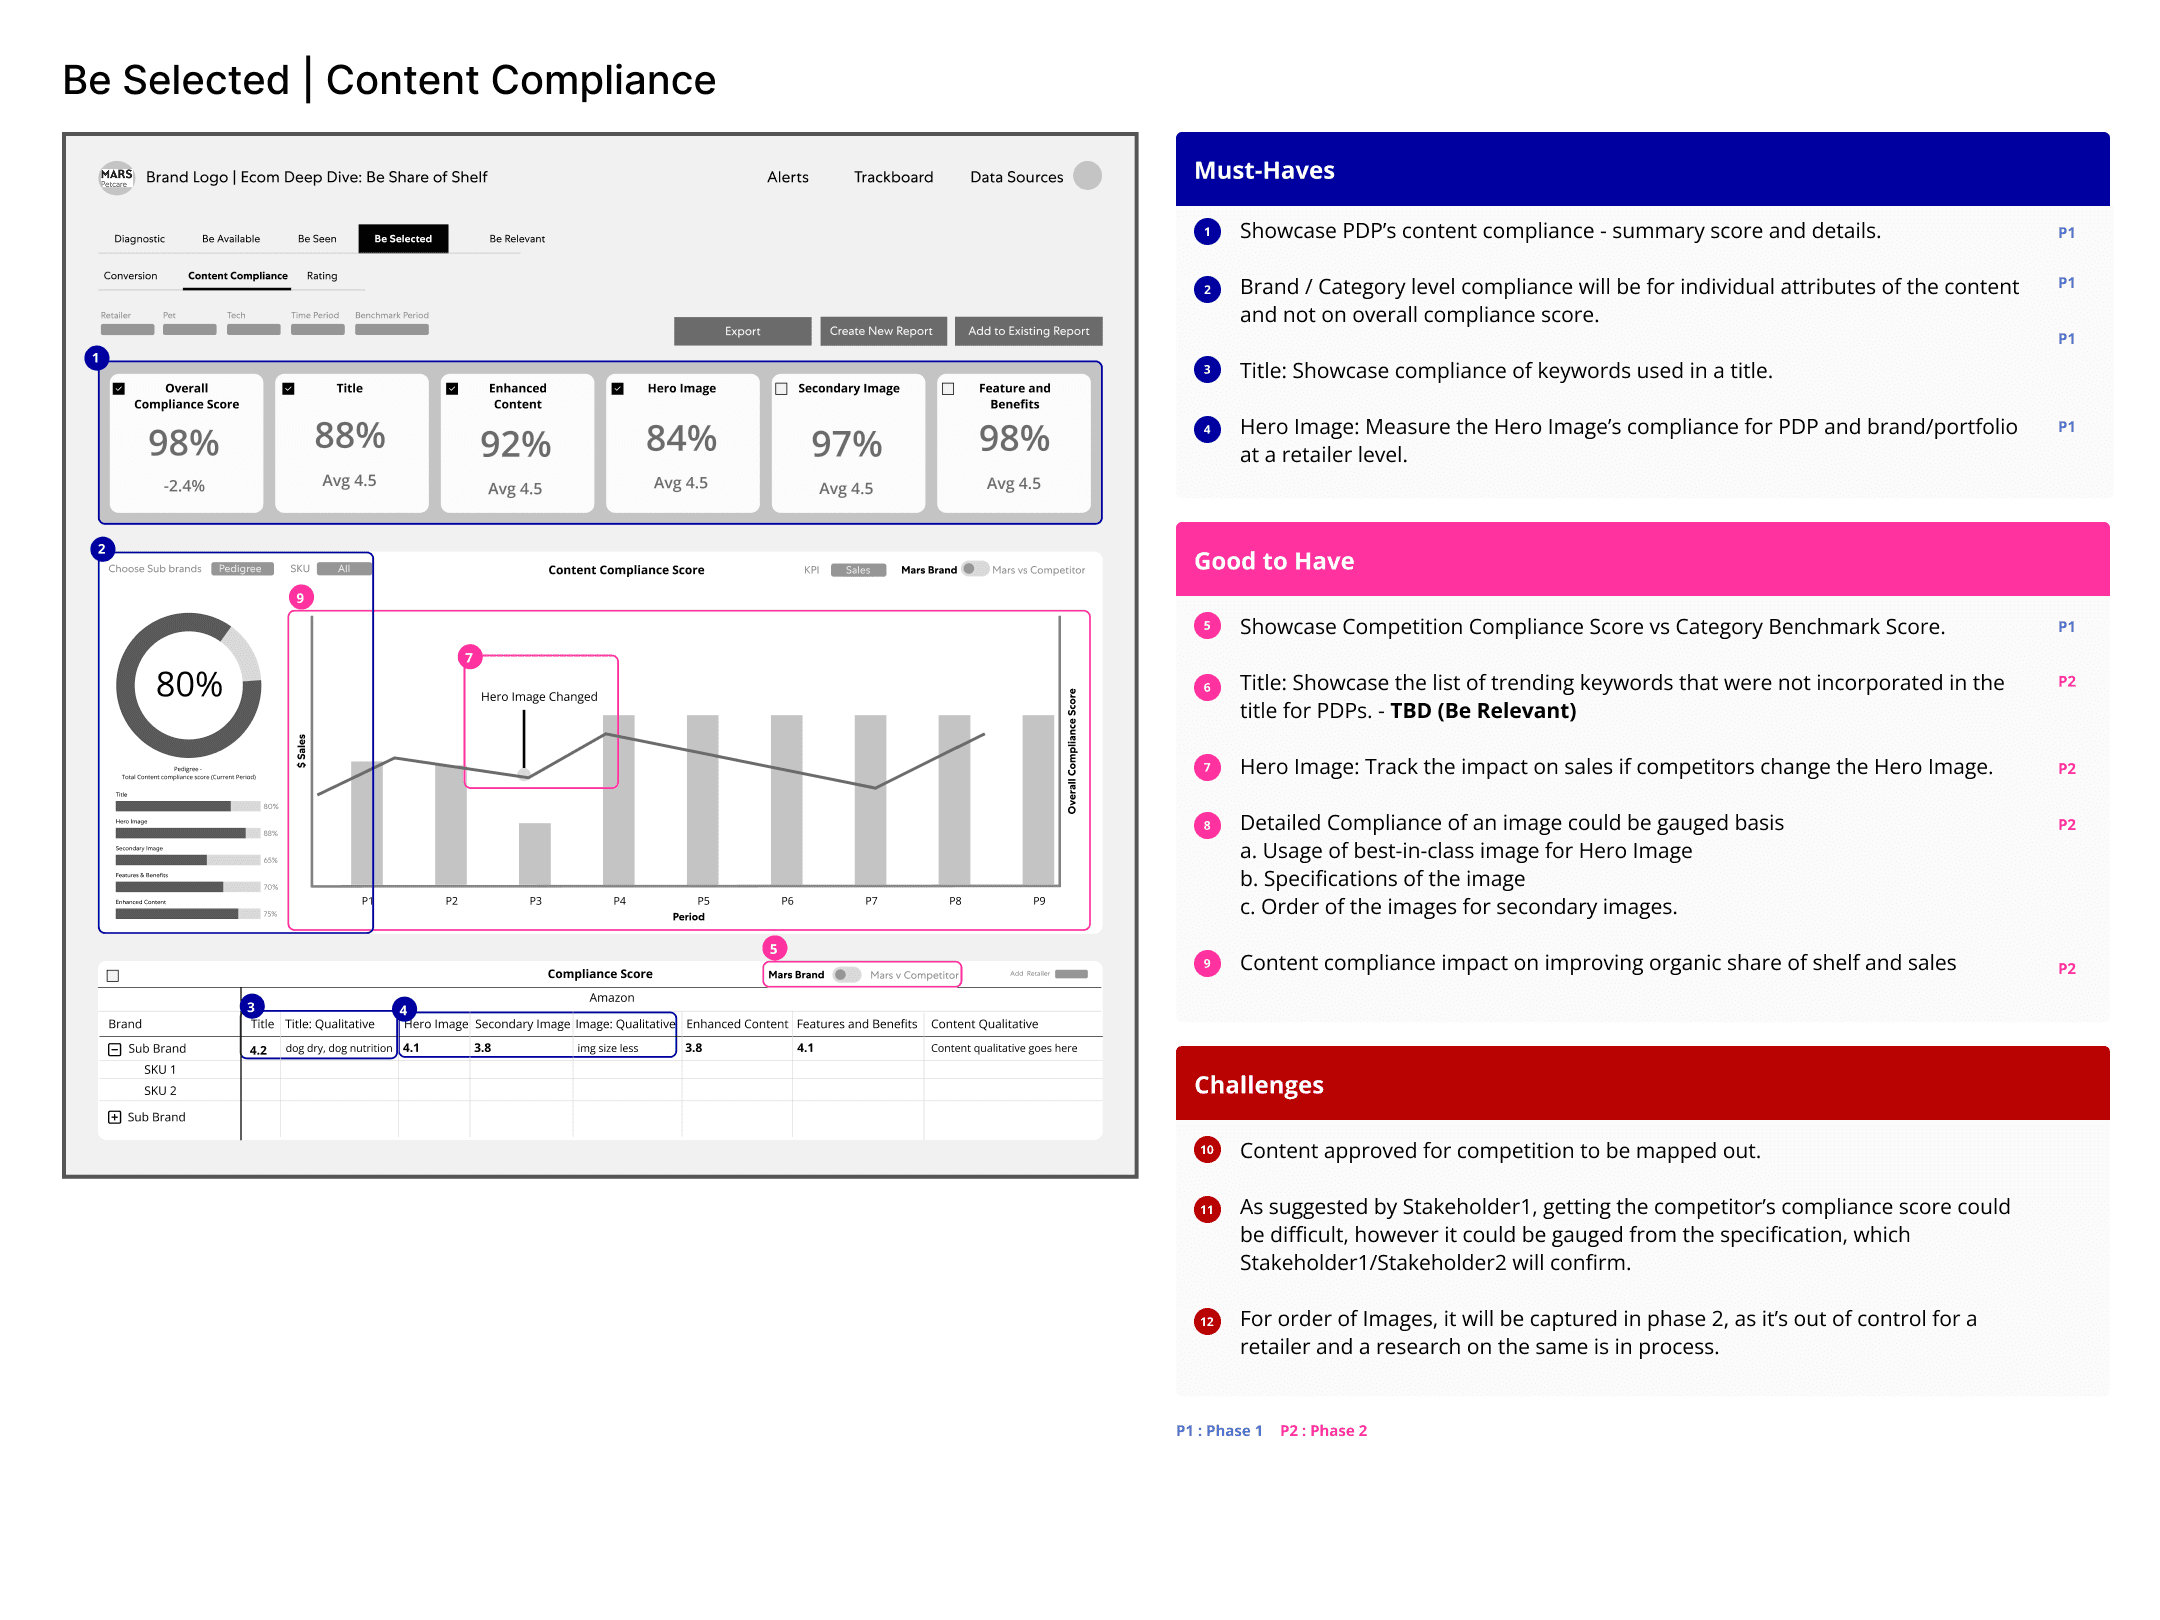
🔹 In-stock rates, traffic by keyword/category 🔸 Selectability indicators: ratings, reviews, search rankings 🔹 Strategy mapping by visibility quadrant
Ecom
🔹 In-stock rates, traffic by keyword/category 🔸 Selectability indicators: ratings, reviews, search rankings 🔹 Strategy mapping by visibility quadrant
Ecom
🔹 In-stock rates, traffic by keyword/category 🔸 Selectability indicators: ratings, reviews, search rankings 🔹 Strategy mapping by visibility quadrant
Forecast
🔹 YOY/5Y forecast by category, tier, channel 🔸 Dynamic visualizations with drill-downs 🔹 Headwinds & tailwinds benchmarking
Forecast
🔹 YOY/5Y forecast by category, tier, channel 🔸 Dynamic visualizations with drill-downs 🔹 Headwinds & tailwinds benchmarking
Forecast
🔹 YOY/5Y forecast by category, tier, channel 🔸 Dynamic visualizations with drill-downs 🔹 Headwinds & tailwinds benchmarking
Media & SOV
🔹 Platform/channel spend vs. share of voice 🔸 Trendlines for brand vs. competition 🔹 Filterable views for A&CP, couponing, organic/promo media
Media & SOV
🔹 Platform/channel spend vs. share of voice 🔸 Trendlines for brand vs. competition 🔹 Filterable views for A&CP, couponing, organic/promo media
Media & SOV
🔹 Platform/channel spend vs. share of voice 🔸 Trendlines for brand vs. competition 🔹 Filterable views for A&CP, couponing, organic/promo media
Media & SOV
🔹 Platform/channel spend vs. share of voice 🔸 Trendlines for brand vs. competition 🔹 Filterable views for A&CP, couponing, organic/promo media
Information Architecture and Solution Blueprint
Information Architecture and Solution Blueprint
Wireframes & Concepts
Wireframes & Concepts
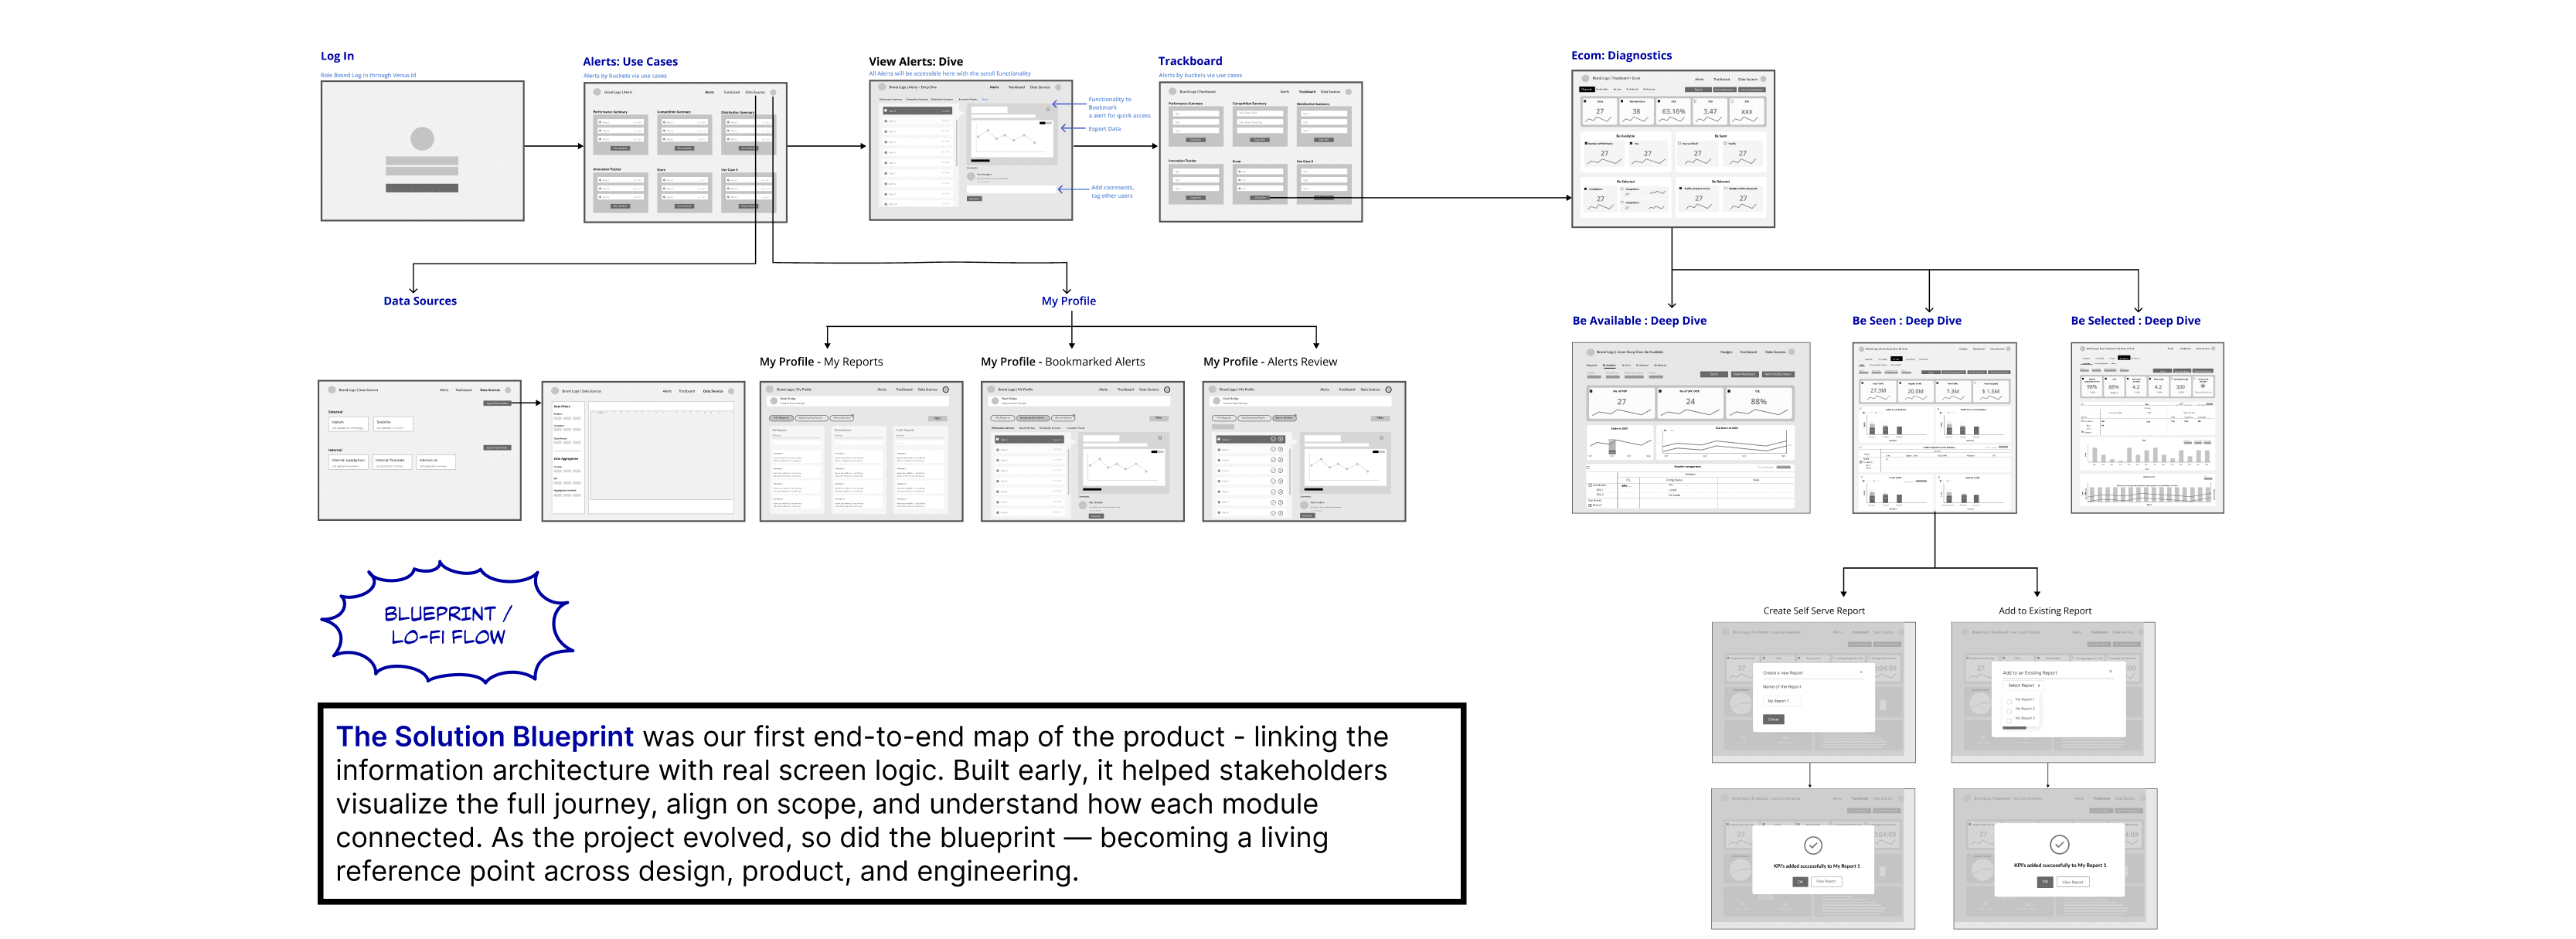
After the synthesis phase, we began crafting the low-fidelity screens with stakeholder-based research and strategic requirements at the core. Every element was intentionally annotated and color-coded, clearly mapping back to must-haves, good-to-haves, challenges, and feedback. This not only ensured alignment with the business context but also made it easier for cross-functional teams to validate and contribute meaningfully during early-stage reviews.
After the synthesis phase, we began crafting the low-fidelity screens with stakeholder-based research and strategic requirements at the core. Every element was intentionally annotated and color-coded, clearly mapping back to must-haves, good-to-haves, challenges, and feedback. This not only ensured alignment with the business context but also made it easier for cross-functional teams to validate and contribute meaningfully during early-stage reviews.

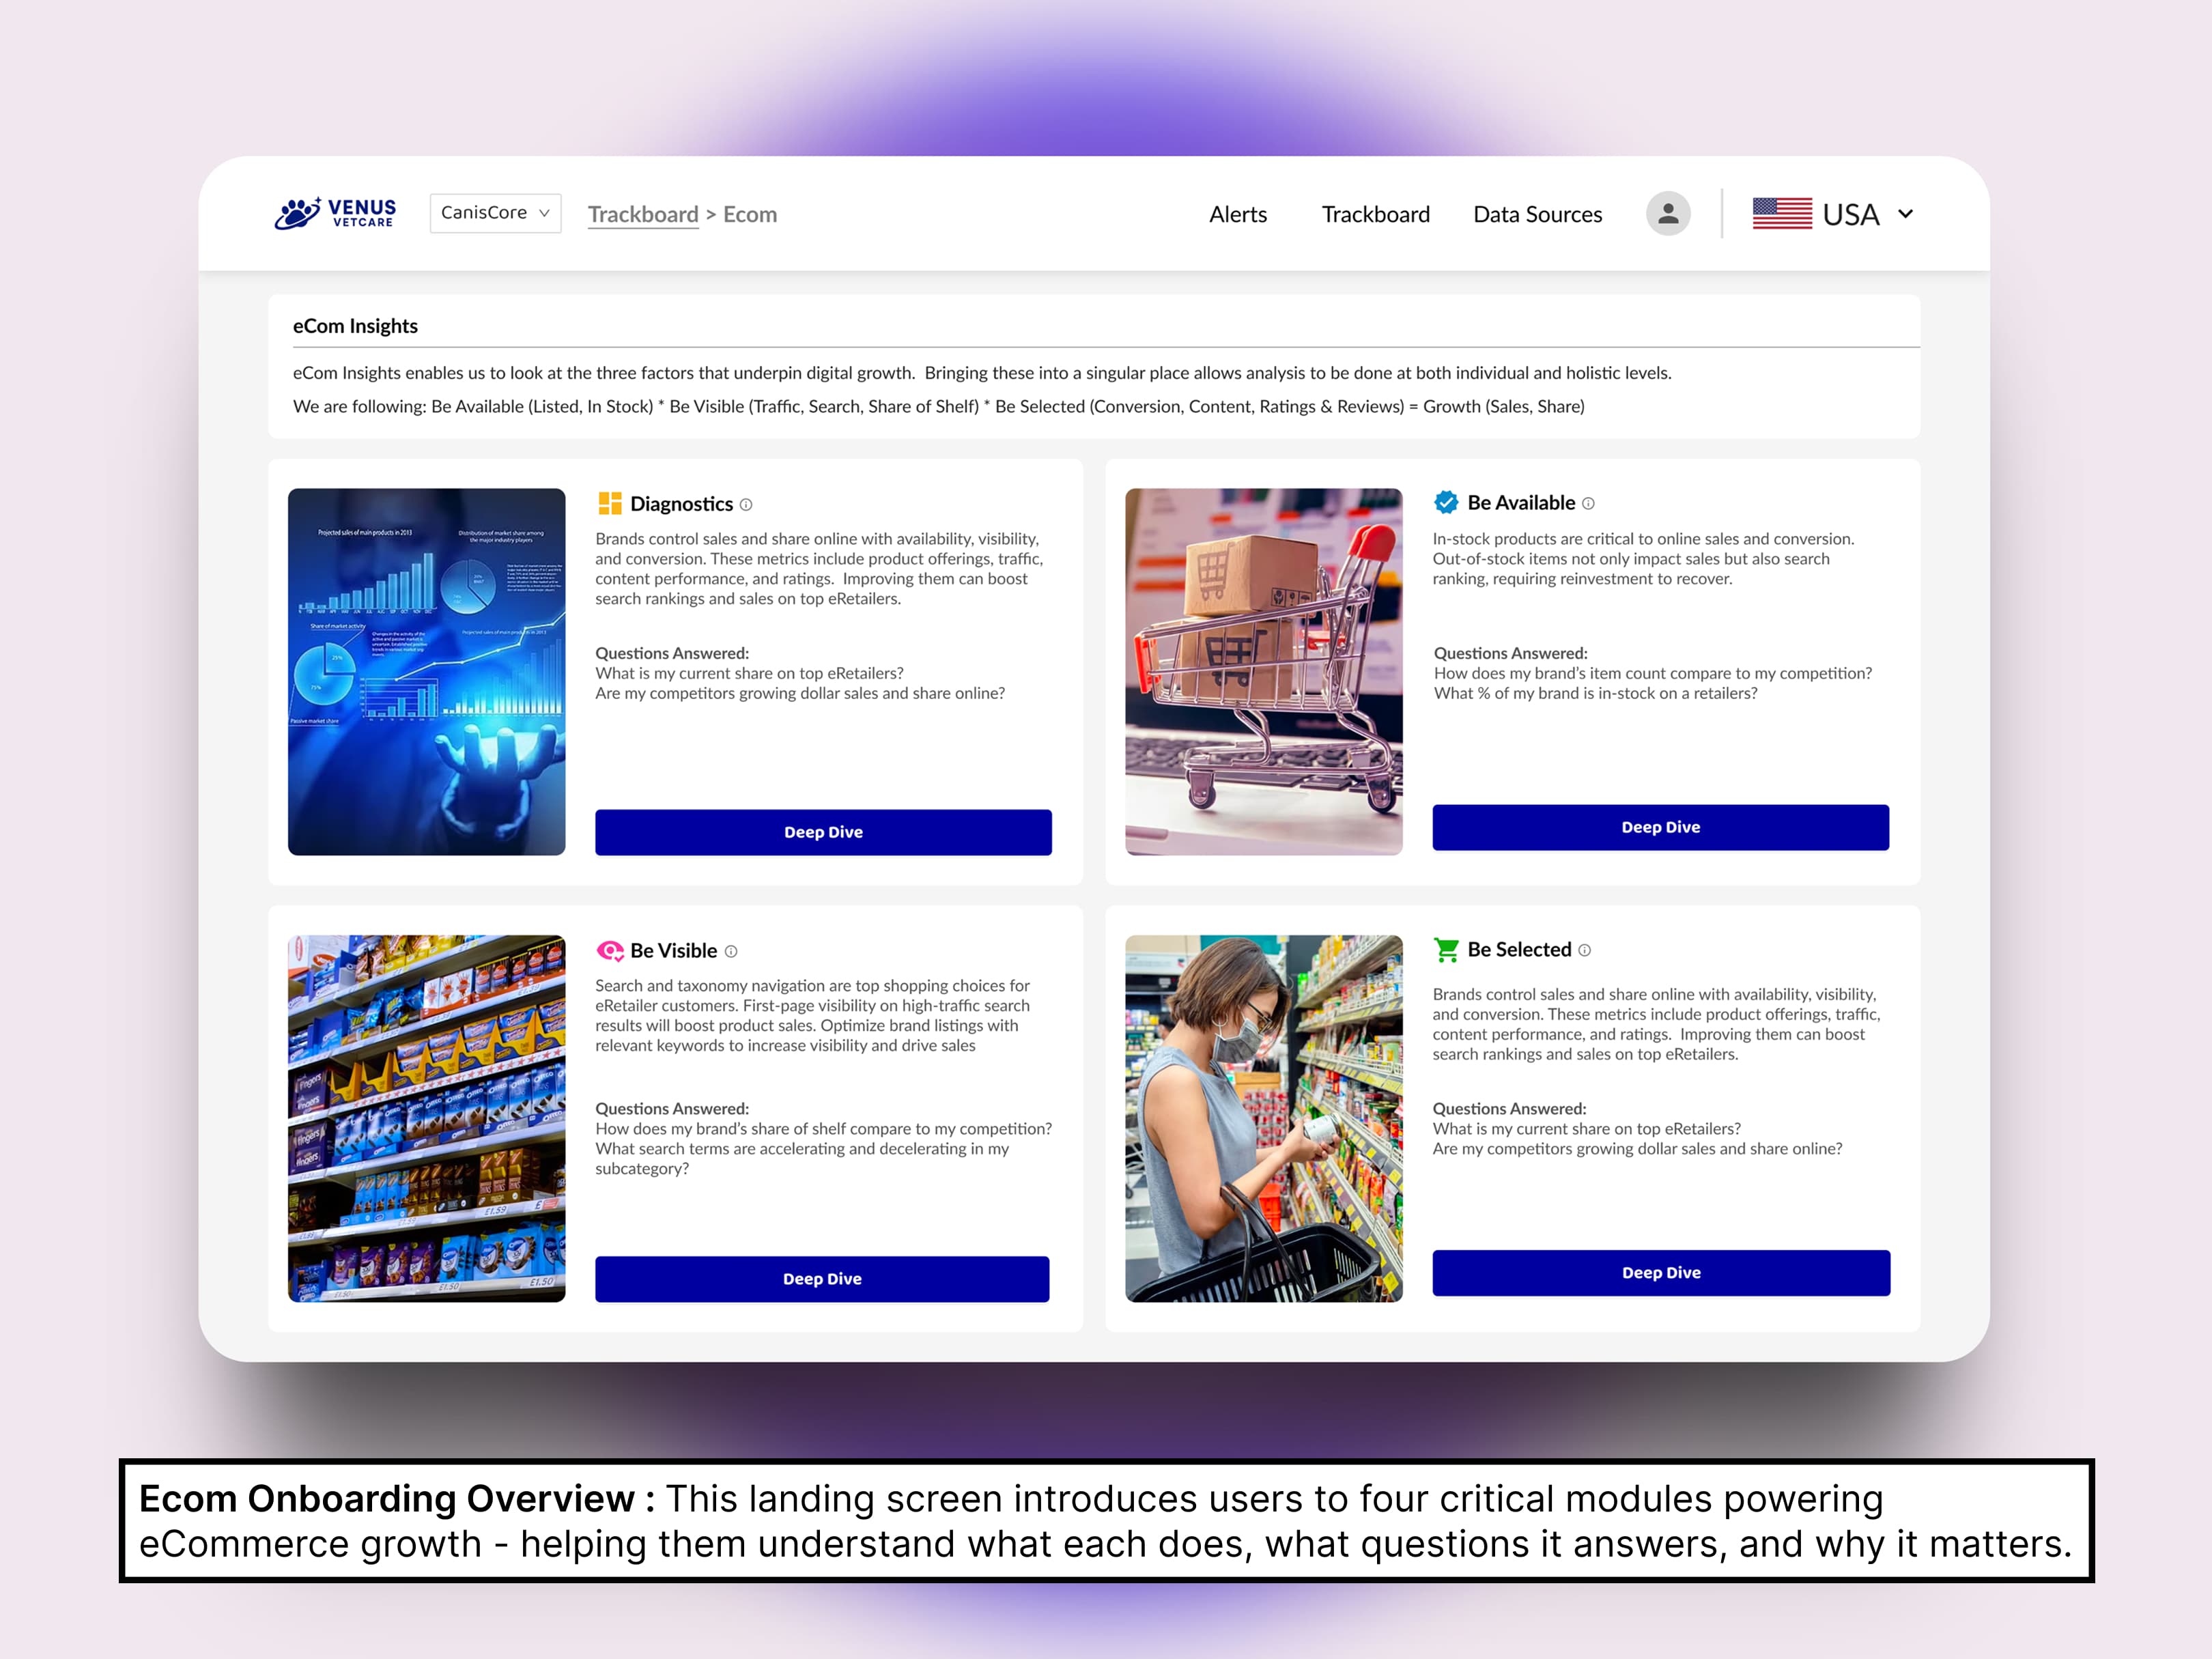
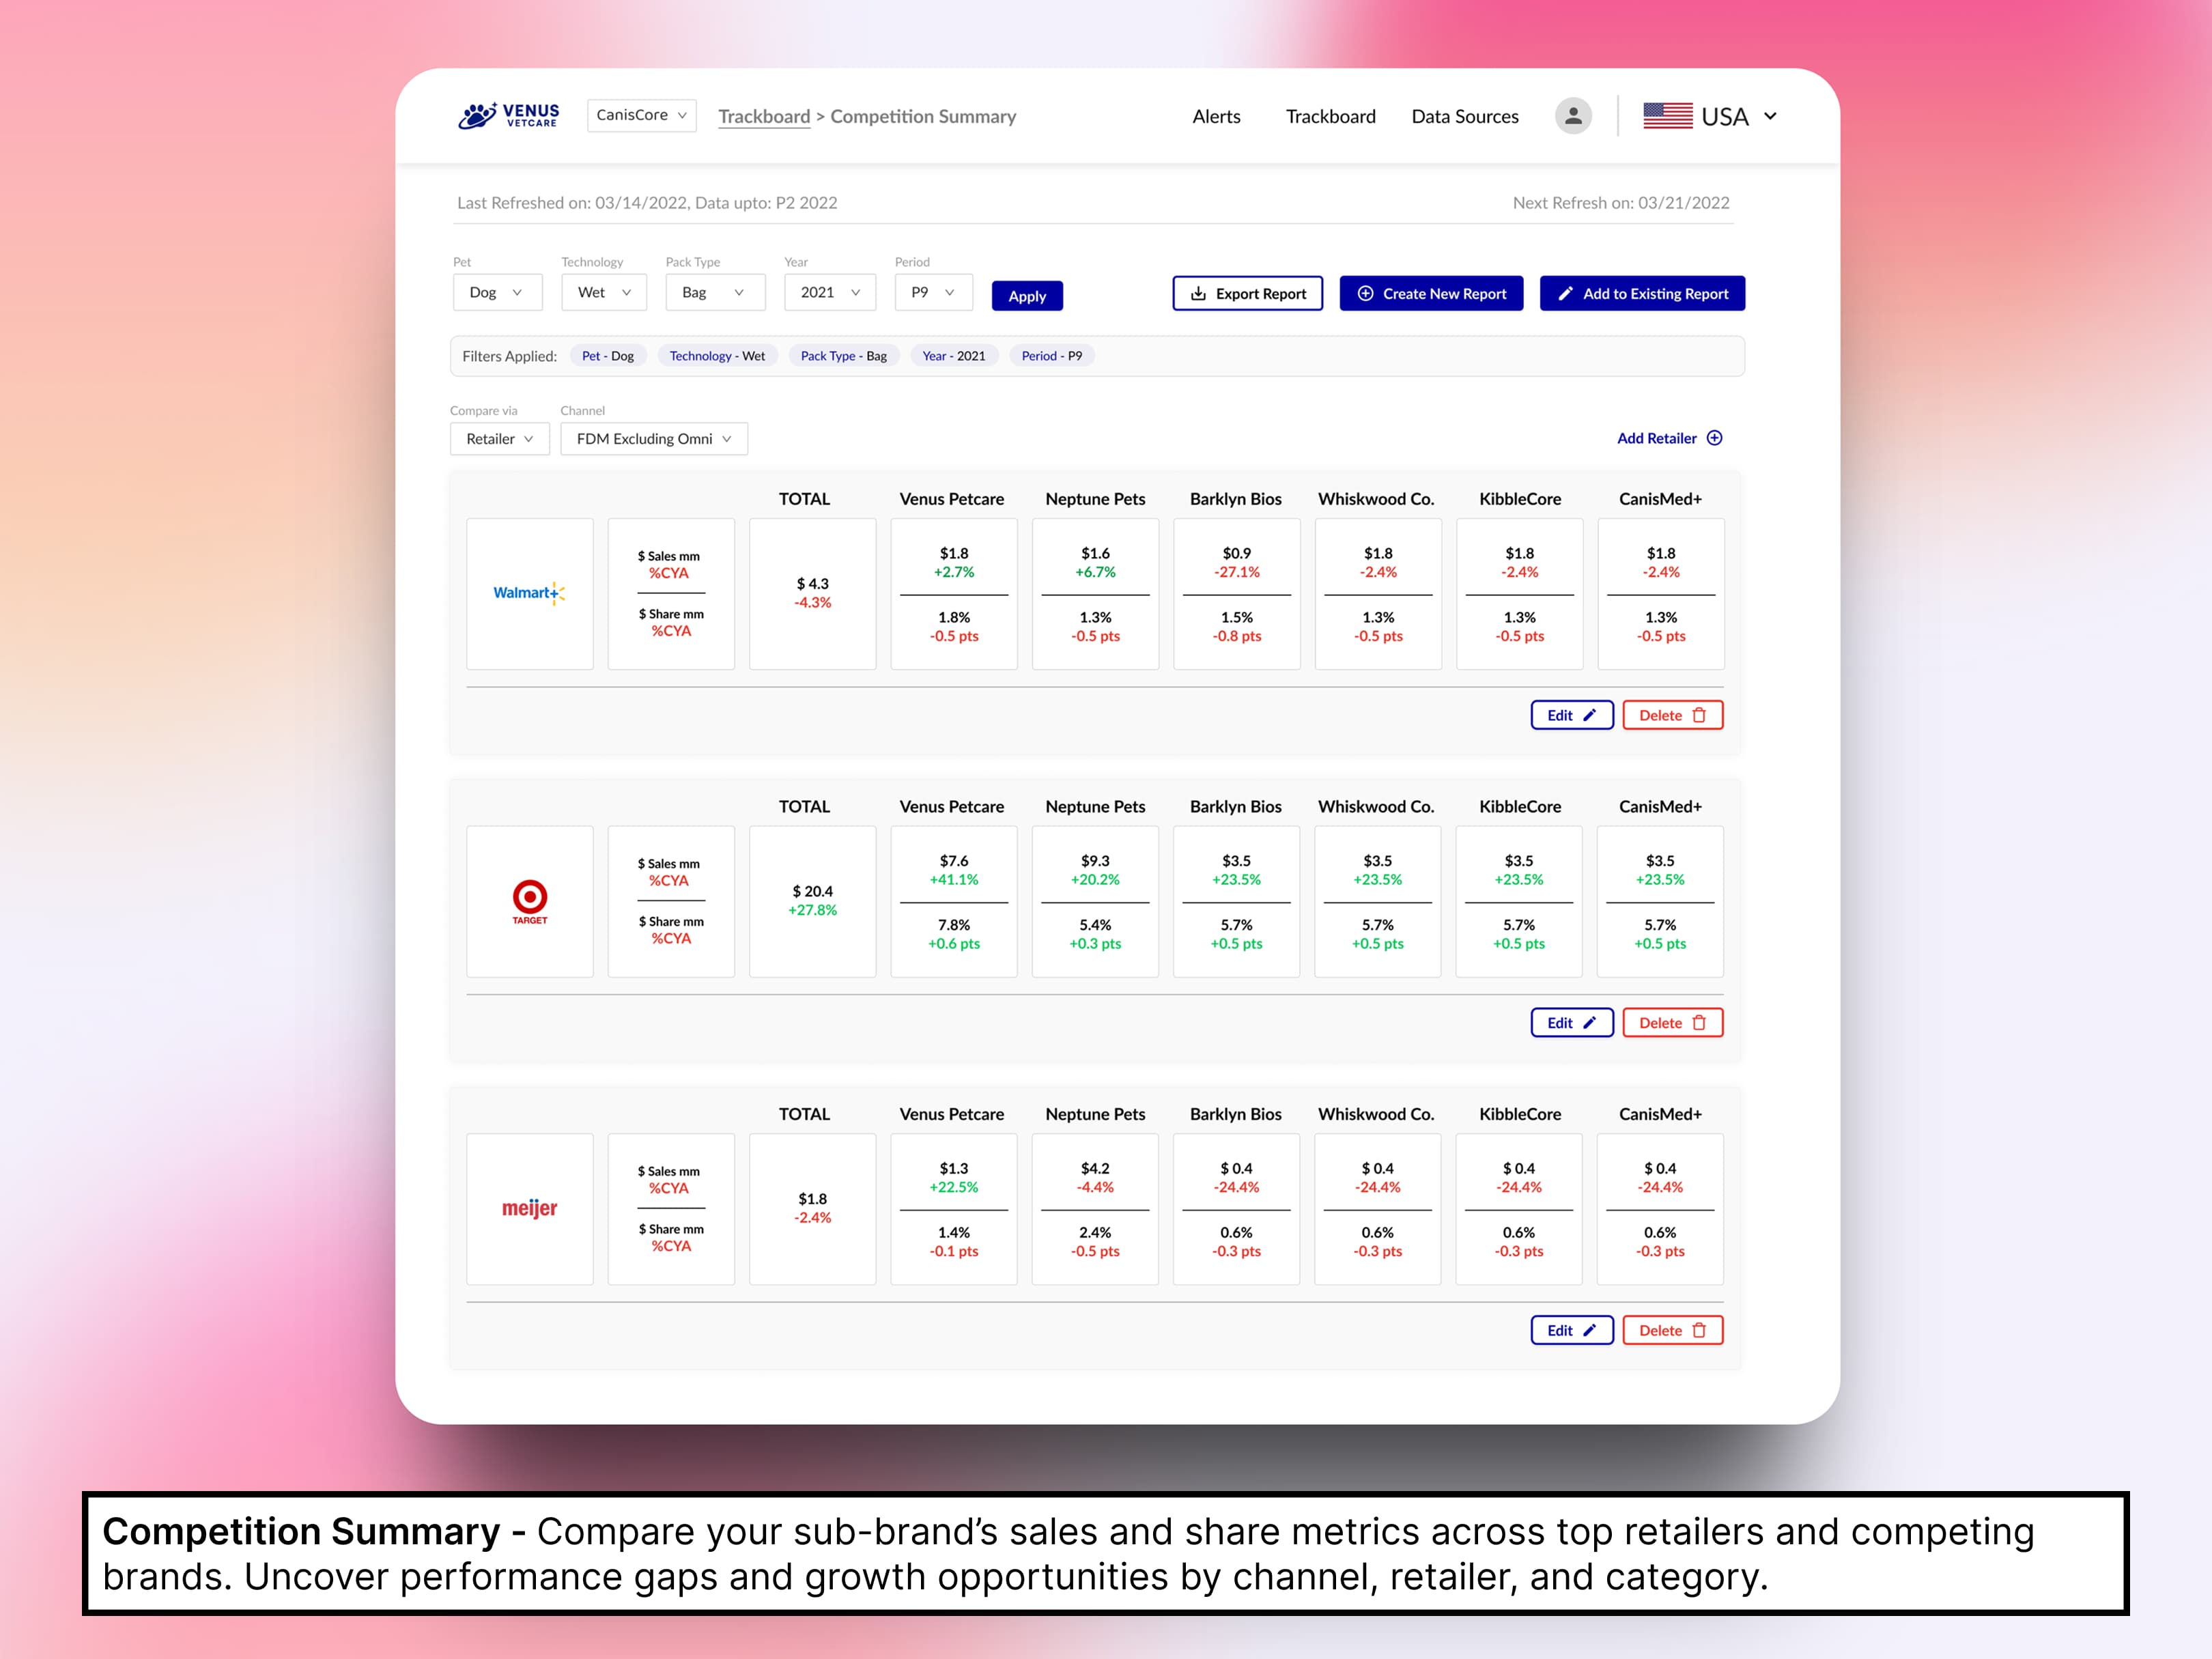
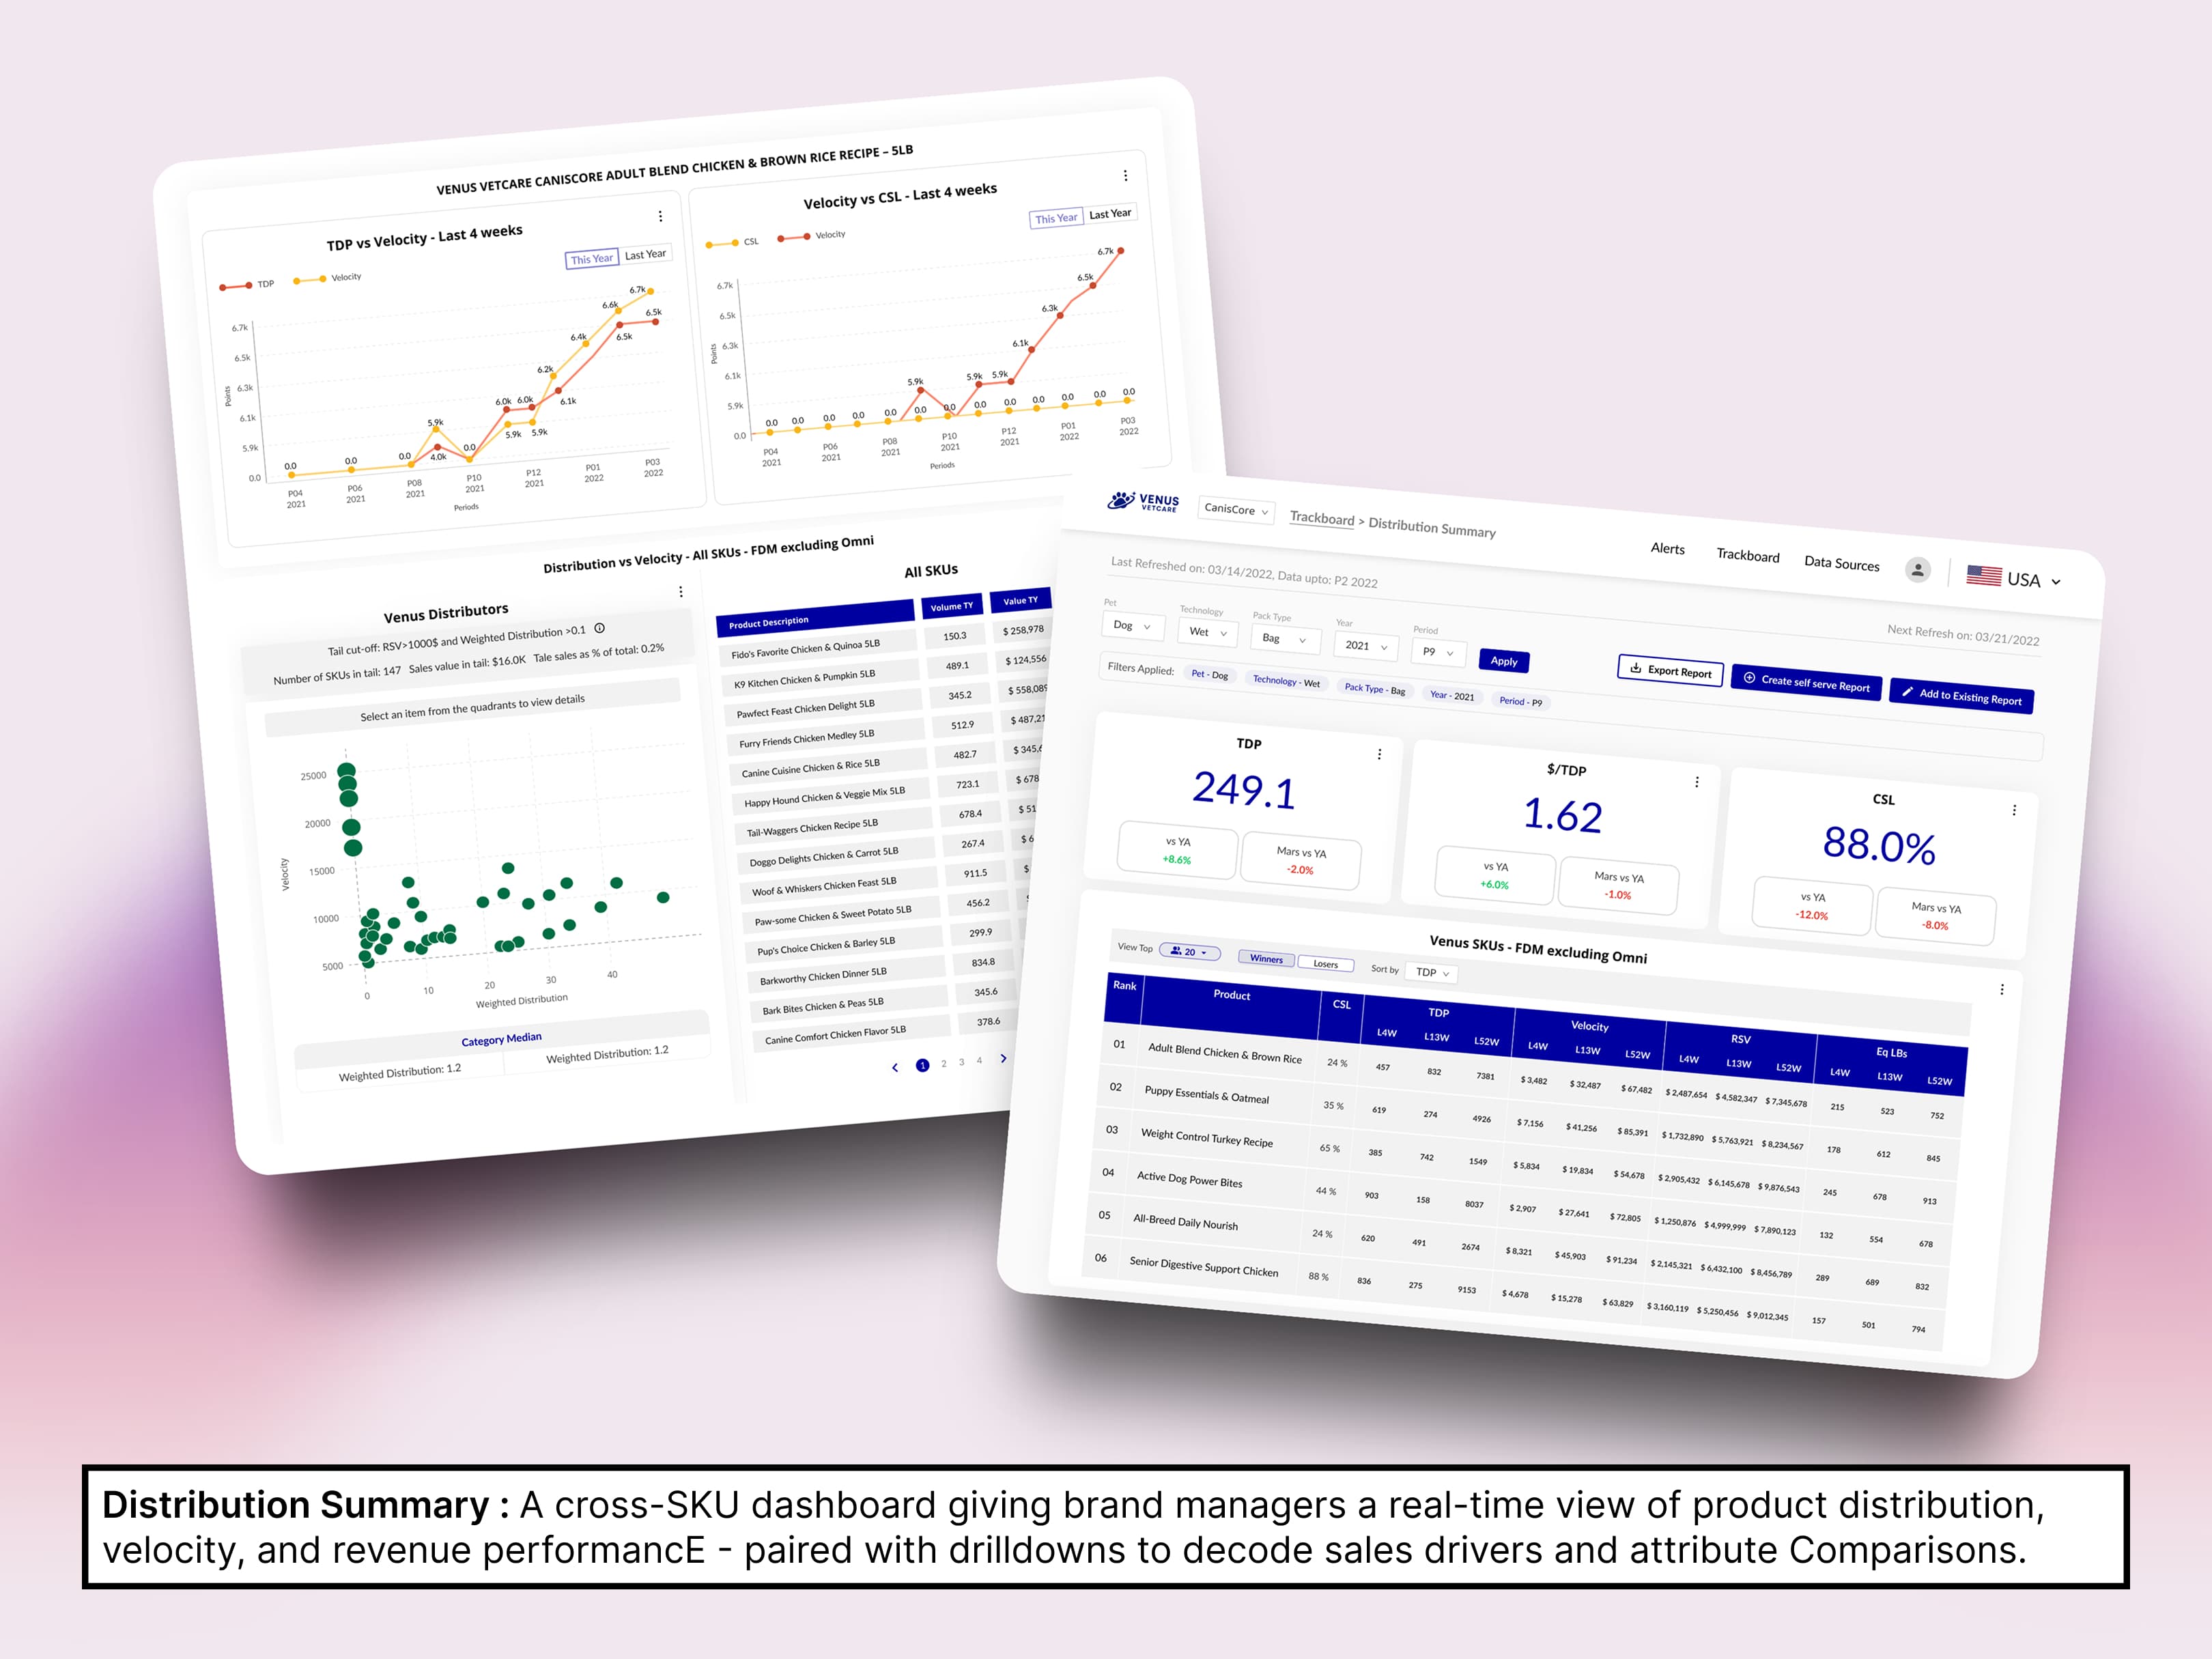
Hi-Fidelity Mockups
Hi-Fidelity Mockups


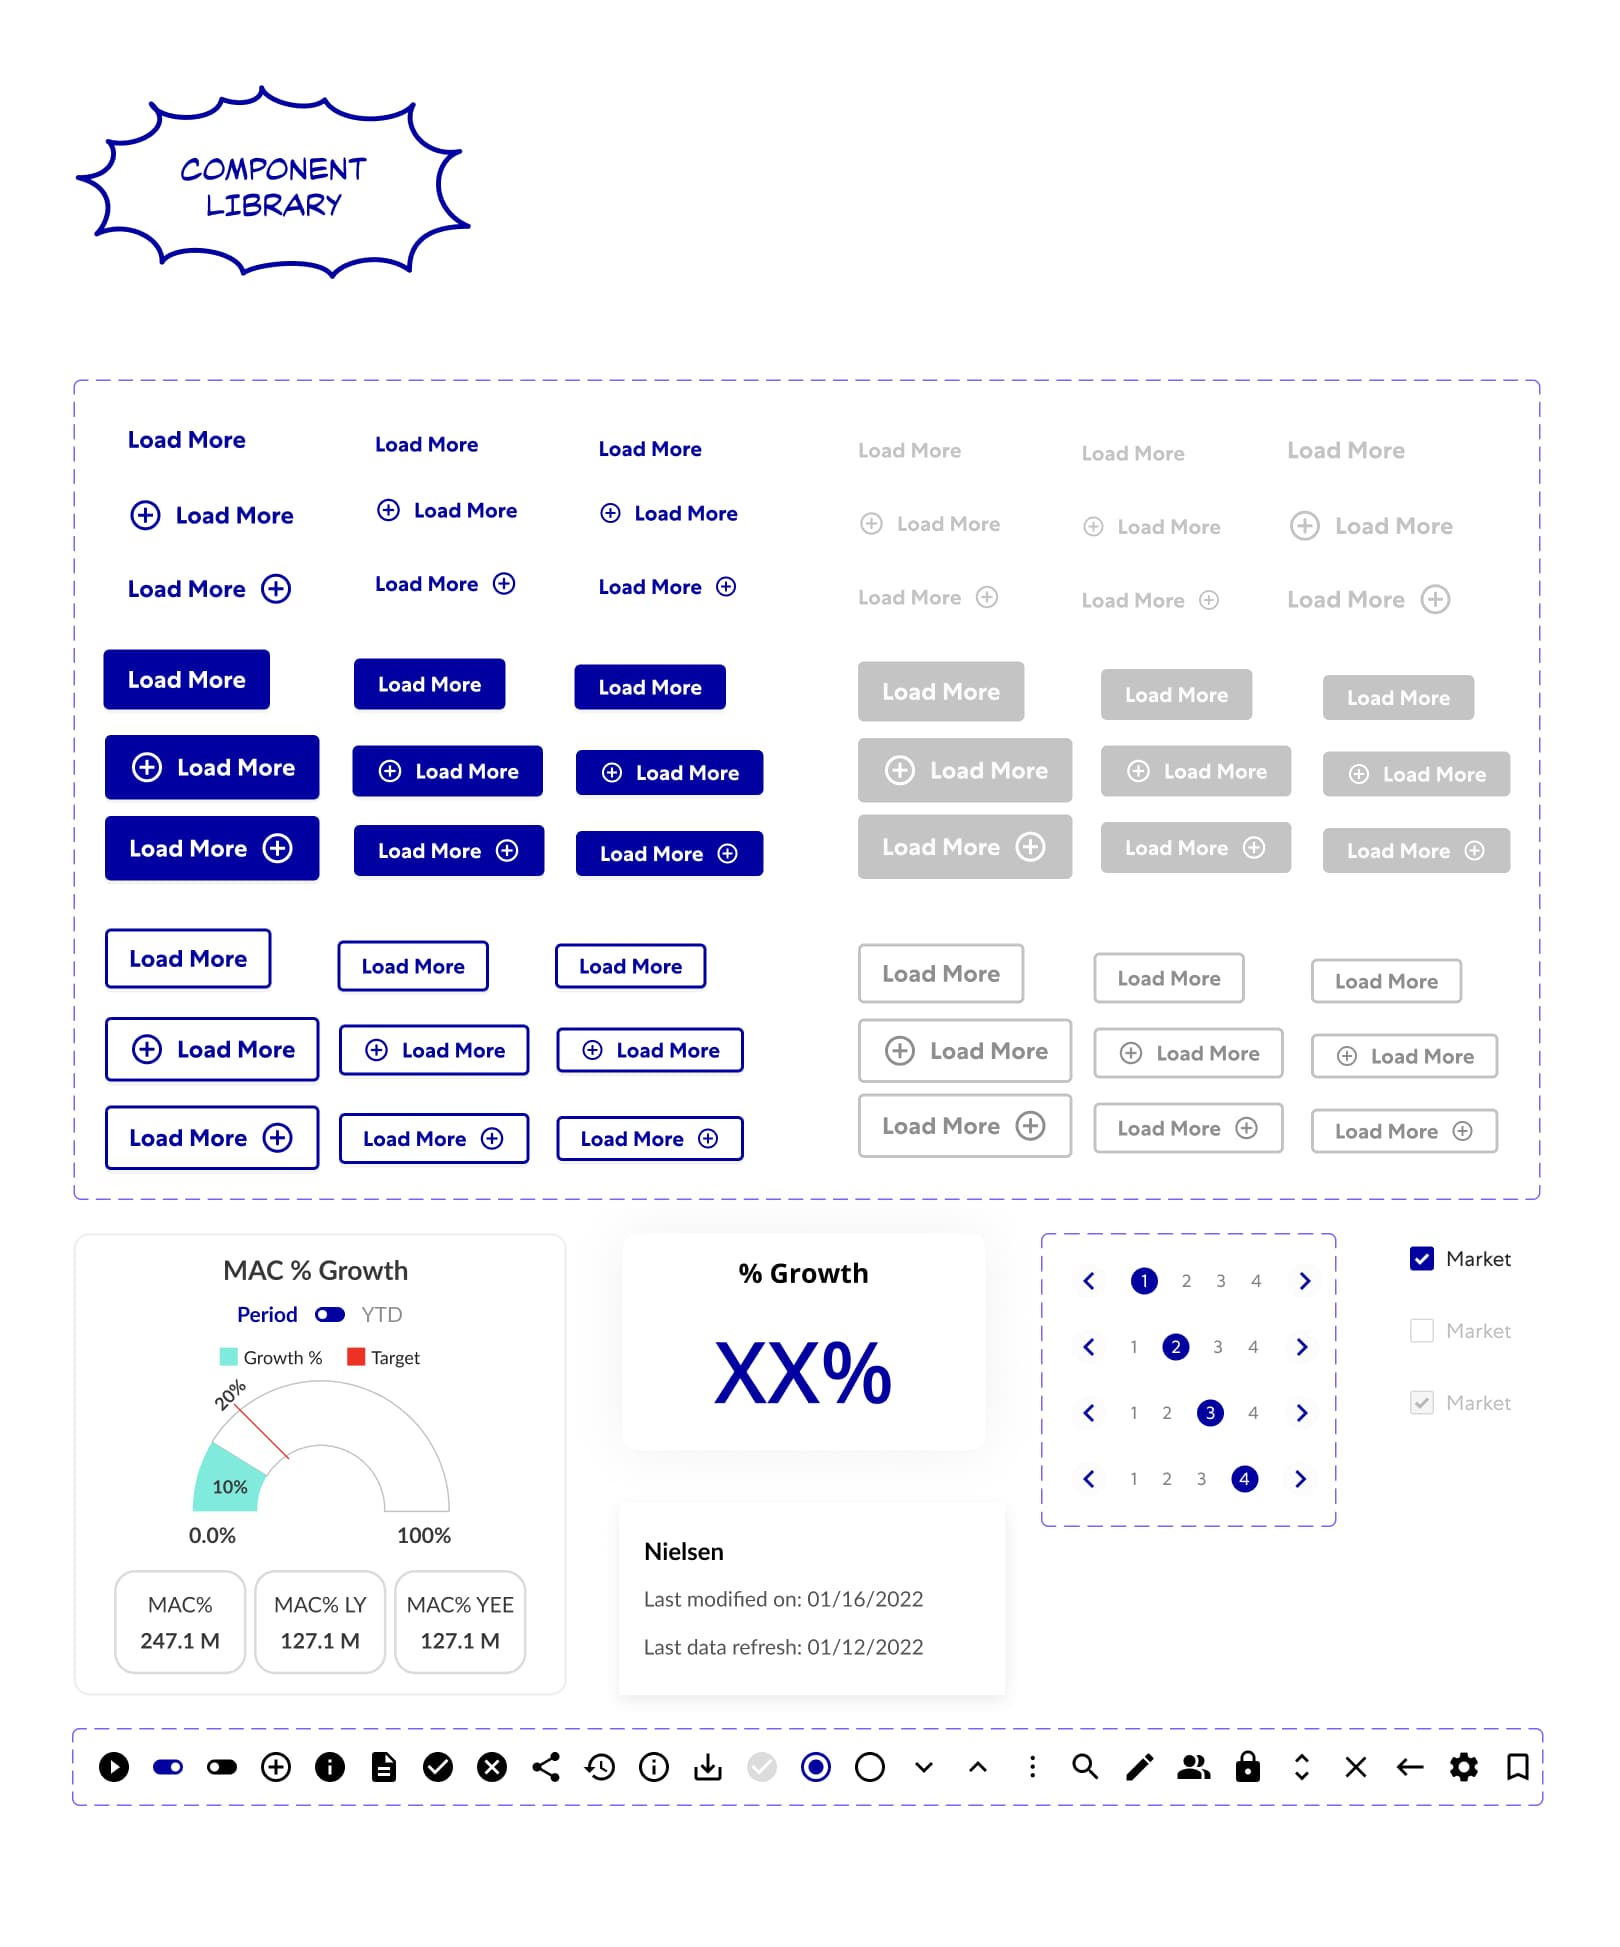
Style Guide & Components
Style Guide & Components

Learnings
Strategic Scoping Reduces Rework
We spent extra time detailing the discovery scope - mapping unknowns, dependencies, and constraints. That investment prevented major pivots later in design.
Strategic Scoping Reduces Rework
We spent extra time detailing the discovery scope - mapping unknowns, dependencies, and constraints. That investment prevented major pivots later in design.
Strategic Scoping Reduces Rework
We spent extra time detailing the discovery scope - mapping unknowns, dependencies, and constraints. That investment prevented major pivots later in design.
Visual Nudges Drive Action
Static KPIs were easy to miss. But pairing numbers with subtle nudges - like color cues, iconography, or layout encouraged quicker decisions from users.
Visual Nudges Drive Action
Static KPIs were easy to miss. But pairing numbers with subtle nudges - like color cues, iconography, or layout encouraged quicker decisions from users.
Visual Nudges Drive Action
Static KPIs were easy to miss. But pairing numbers with subtle nudges - like color cues, iconography, or layout encouraged quicker decisions from users.
Reusability Pays Off Later
We built a modular component system from day one, which saved us time every time we scaled or introduced new views.
Reusability Pays Off Later
We built a modular component system from day one, which saved us time every time we scaled or introduced new views.
Reusability Pays Off Later
We built a modular component system from day one, which saved us time every time we scaled or introduced new views.
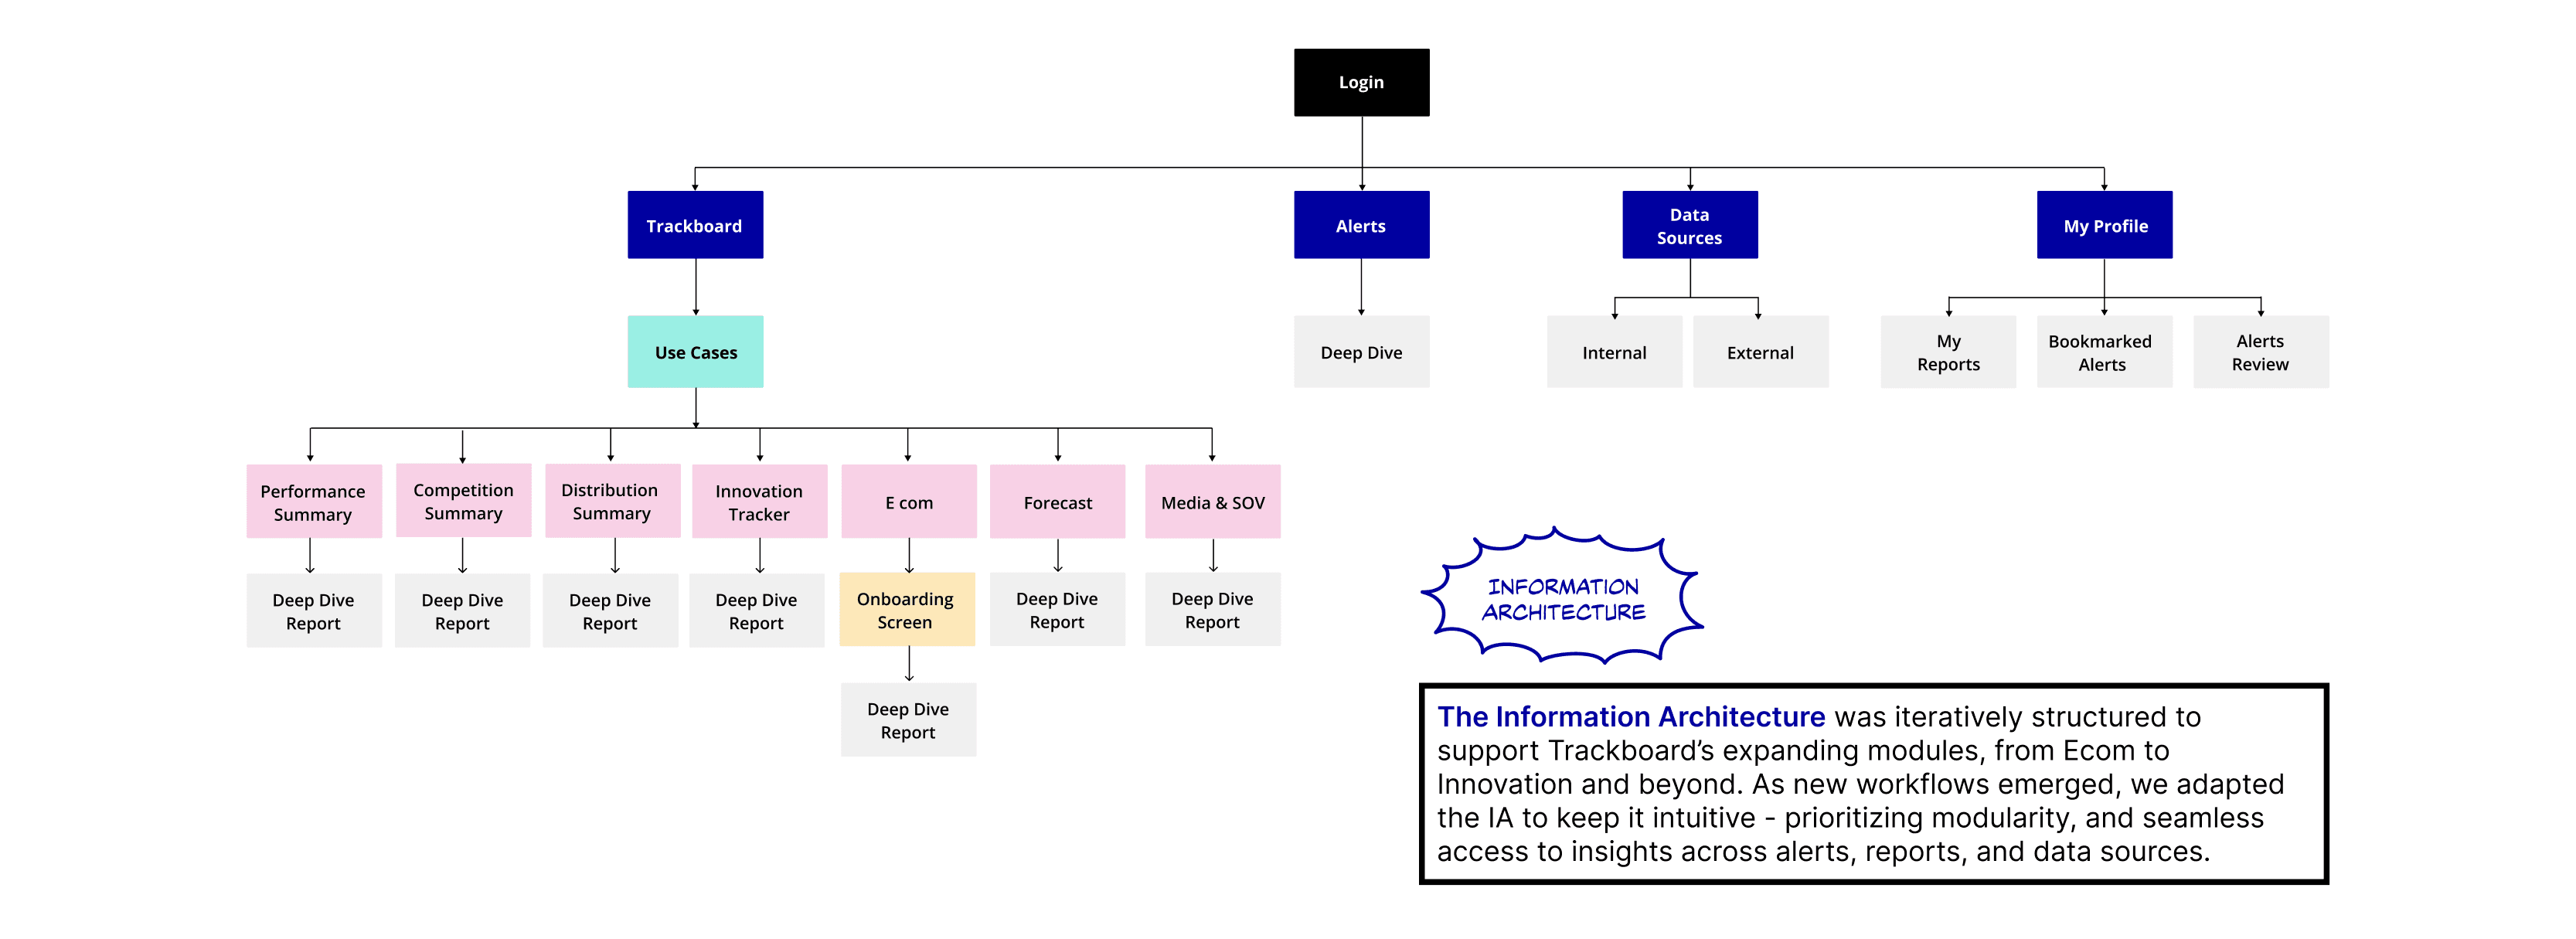
IA is the North Star
A cohesive Information Architecture helped everyone - devs, PMs, and users navigate the tool more intuitively. The blueprint became our source of truth.
IA is the North Star
A cohesive Information Architecture helped everyone - devs, PMs, and users navigate the tool more intuitively. The blueprint became our source of truth.
IA is the North Star
A cohesive Information Architecture helped everyone - devs, PMs, and users navigate the tool more intuitively. The blueprint became our source of truth.